

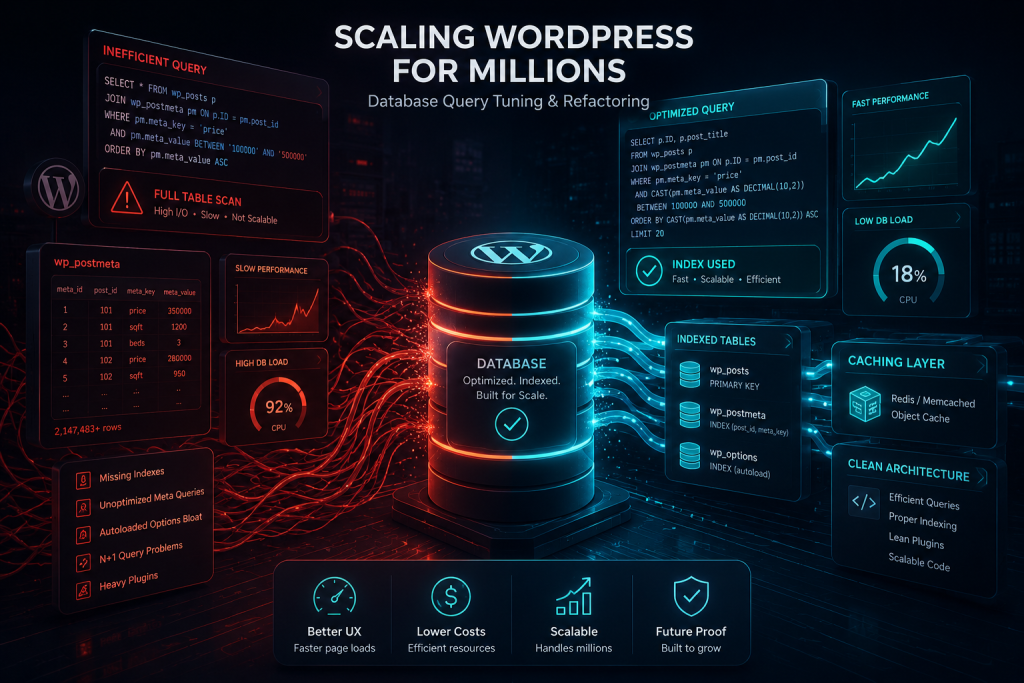
Scaling WordPress for Millions: A Deep Dive into Database Query Tuning and Refactoring
A real estate portal serving thousands of listings moves to a premium managed hosting plan after months of complaints about slow page loads. The migration goes smoothly. Server response times improve for exactly two weeks. Then traffic climbs back to its normal level and the site slows down again, in the same places, on the same pages, in almost the same way it did before the upgrade. The hosting bill has tripled. The problem has not moved an inch.
This is one of the most common and most misunderstood failure patterns in WordPress performance work, and it catches technically sophisticated teams as consistently as it catches beginners. Hosting infrastructure and database query efficiency are two separate problems, and upgrading one does nothing to fix the other. A faster server executes an inefficient query faster, but it is still executing an inefficient query, and at real traffic volume, an inefficient query does not stay fast for long no matter how much hardware sits underneath it. This piece is a deep, technical look at what actually happens when a high traffic WordPress site slows down under its own database, how to find the real cause rather than guessing at it, and what a genuine refactor looks like when plugin level fixes have already been tried and have already failed.
The Infrastructure Truth: Why Hosting Is Not a Magic Fix
Premium hosting solves a specific, narrow category of problem well. It gives a site more raw compute, more memory, faster disk access, and, in many configurations, a more sophisticated caching layer sitting in front of the application. For a site whose slowness comes from insufficient server resources, an upgrade genuinely fixes the problem, because the underlying bottleneck was resource scarcity in the first place.
A site whose slowness comes from inefficient database queries is dealing with a fundamentally different problem, and premium hosting does not touch it. A query that scans an entire table because it lacks a proper index will still scan that entire table on a more powerful server. It will do it faster in absolute terms, because the server has more raw processing power to throw at the scan, but the query is still doing far more work than it needs to, and that inefficiency scales directly with the size of the table and the volume of traffic hitting it. A site with ten thousand posts and modest traffic can go years without ever surfacing a poorly indexed query as a visible problem. The same query, on a site with two million posts and thousands of concurrent visitors, becomes the specific reason the site falls over during a traffic spike, regardless of how much money is being spent on hosting.
This distinction matters enormously for a CTO or product manager trying to diagnose a performance problem, because the two categories of fix live in completely different parts of the stack and require completely different expertise to address. A hosting upgrade is a procurement decision. Query optimization is an engineering task that requires reading actual SQL, understanding how WordPress’s core query functions build that SQL, and knowing specifically what a custom post type, a complex meta query, or a poorly written plugin hook is actually asking the database to do under the hood.
The businesses that get stuck in an expensive, ineffective cycle are the ones that keep treating a query level problem as an infrastructure level problem, upgrading hosting repeatedly, adding more caching layers on top of caching layers, without anyone actually opening the database and asking which specific queries are slow and why. Infrastructure spending has a ceiling on how much it can compensate for genuinely inefficient queries. Past that ceiling, no reasonable hosting budget fixes the underlying problem, because the problem was never about raw compute in the first place.
What Actually Slows Down a High Traffic WordPress Database
WordPress’s database schema was designed for flexibility across an enormous range of use cases, from a small personal blog to an enterprise publishing platform, and that flexibility comes with specific, well understood tradeoffs that become genuine liabilities at scale.
The postmeta table and the entity attribute value problem. WordPress stores custom field data, the specific values attached to posts, products, or listings, in the wp_postmeta table using an entity attribute value structure: each row holds a post ID, a meta key, and a meta value, rather than dedicated columns for each specific field. This structure is what makes WordPress so flexible for arbitrary custom fields, and it is also what makes postmeta one of the largest, most heavily queried tables on almost every real world WordPress site. A real estate portal storing a dozen custom fields per listing, price, square footage, bedroom count, location coordinates, amenities, generates a dozen rows in postmeta for every single listing. A portal with two hundred thousand listings is looking at well over two million rows in that one table before accounting for any other post type on the site.
Meta queries that cannot use indexes effectively. Filtering or sorting posts by a custom field value, a routine operation for a real estate portal filtering by price range or an LMS filtering courses by difficulty level, requires WordPress to query the postmeta table using WP_Query’s meta_query parameter. Because meta_value is stored as a generic text field regardless of whether the underlying data is actually numeric, filtering or sorting by a numeric custom field without explicitly telling WordPress to treat it as a number produces a query that cannot use a standard index efficiently, forcing a much slower comparison across every matching row.
Autoloaded options bloat. WordPress loads every option marked for autoload on every single page request, regardless of whether that specific page actually needs that option’s value. Plugins that store large amounts of data as autoloaded options, without a legitimate reason for that data to load on every page, silently add overhead to every request on the site. This is a common and frequently invisible cause of a site that feels sluggish across the board rather than slow on any one specific page, and it tends to accumulate gradually as more plugins get installed over a site’s lifetime, with nobody noticing the cumulative effect until autoloaded data has grown to a size that meaningfully delays every page load.
Custom post types and taxonomies at genuine scale. A real estate listing, a course in a learning management system, a product in a large catalog, these are typically implemented as custom post types, and WordPress’s default query behavior for custom post types was not built with millions of rows specifically in mind. Complex filtering across multiple taxonomies and multiple meta fields simultaneously, exactly the kind of filtering a real estate search page or an LMS course catalog needs to support, can produce queries with several expensive table joins that were never a problem during development on a small dataset and become a serious bottleneck once the live dataset reaches genuine production scale.
Identifying the Bottlenecks: Finding the Actual Slow Queries
Fixing a database performance problem starts with identifying, specifically and concretely, which queries are actually slow, rather than guessing based on which pages feel sluggish. This distinction matters because intuition about performance is frequently wrong, and the actual bottleneck is regularly a query running on a page nobody would have suspected.
Query Monitor is the starting point for almost any serious WordPress performance investigation. Unlike a general purpose caching or optimization plugin, Query Monitor shows every database query executed on a given page load, how long each one took, and which specific piece of code, a theme template, a plugin function, a hook callback, triggered it. This visibility is what turns a vague complaint about a slow page into an actionable, specific finding: this exact query, triggered by this exact function, took this many milliseconds, and here is the full SQL that was actually sent to the database.
The MySQL slow query log provides a complementary, production level view. While Query Monitor shows queries for a single page load during active debugging, the slow query log captures every query across the entire site that exceeds a configured time threshold, over real production traffic, from real users, rather than a single developer’s test session. This is essential for catching queries that are only slow under genuine concurrent load, a pattern that frequently does not reproduce cleanly in a low traffic staging environment no matter how carefully a developer tries to simulate it.
EXPLAIN and query execution plans are what turn a known slow query into an understood one. Running EXPLAIN against a specific SQL statement shows exactly how MySQL intends to execute it: which indexes it plans to use, if any, how many rows it expects to examine, and whether it intends to use an efficient index lookup or fall back to a full table scan. A query that examines a few dozen rows using a proper index and a query that scans two million rows because no usable index exists can look identical in application code while behaving completely differently at the database level, and EXPLAIN is the tool that reveals which one you are actually dealing with.
Debugging Slow Loading Custom Post Types
Custom post types deserve specific, targeted debugging attention because they are frequently the source of the worst performance problems on content heavy, high traffic sites, and because their queries are regularly more complex than a simple post listing.
A real estate portal’s search page is a representative example. A user filters by price range, bedroom count, location, and property type simultaneously. Under the hood, this single page request can translate into a WP_Query with multiple meta_query clauses joined together, each one requiring the query to touch the postmeta table again, plus a tax_query for property type, plus sorting by a specific meta field like price. Each additional condition adds another join or another subquery to the underlying SQL, and the combined query can become dramatically more expensive than any of its individual pieces would suggest in isolation.
Debugging this properly means using Query Monitor on the actual search page, with actual, realistic filter combinations applied, not just the default unfiltered listing page a developer tests during initial build. It means checking whether meta_query conditions specify a numeric type where the underlying data is genuinely numeric, since without that explicit type declaration WordPress defaults to a text comparison that cannot use an index efficiently regardless of how the underlying column is actually structured. It means checking whether frequently filtered meta keys have any index support at all, since WordPress’s default postmeta table structure only indexes meta_key by default, not the combination of meta_key and meta_value that a real filtering query actually needs to search efficiently.
The Hooks and Actions Problem
WordPress’s hook system, actions and filters, is the mechanism that makes the platform so extensible, and it is also a frequent, hidden source of database performance problems that never show up in a straightforward code review, because the performance cost is distributed across many separate, individually reasonable looking pieces of code.
The specific pattern to watch for is a hook callback that runs an additional database query for every single post in a loop, commonly called an N plus one query problem. A theme or plugin displaying a list of twenty properties, with a hook callback that queries for related agent information separately for each property individually rather than fetching all twenty agents in a single batched query, turns what should be one or two total queries into twenty one separate ones. This pattern is invisible in a code review of any single function, since each individual query looks entirely reasonable on its own. It only becomes visible when you look at the full picture across an entire page load, which is exactly what Query Monitor is built to reveal, by showing not just how many queries ran but which specific hook or function triggered each one and how many times that pattern repeated across a single request.
This N plus one pattern is one of the single most common causes of a page that performs acceptably during development, when a test dataset has five or ten items in a loop, and then degrades sharply in production once that same loop is running against fifty or a hundred real items on a genuinely busy page.
Beyond the Plugin: Object Cache Setup
A general purpose caching plugin, the kind most WordPress sites already run, primarily addresses page level caching: storing a fully rendered HTML page so subsequent identical requests can be served without regenerating that page from scratch. This is valuable, but it does nothing for logged in users, for pages with genuinely dynamic, personalized content, or for the admin dashboard itself, all of which bypass page caching entirely by design and hit the database directly on every single request.
A persistent object cache addresses this different, deeper layer. Instead of caching entire rendered pages, an object cache stores the results of individual database queries and WordPress object lookups in memory, using a system like Redis or Memcached, so that repeated requests for the same underlying data, a specific post, a specific set of options, a specific user’s data, can be served from fast memory rather than requiring a fresh database query every single time.
Without persistent object caching, WordPress’s internal object cache exists only in memory for the duration of a single page request and disappears the moment that request finishes, providing no benefit at all across separate requests from different visitors. This means the exact same query, fetching the exact same unchanged data, gets executed fresh against the database for every single page view, even when the underlying data has not changed in any way since the last time it was fetched. On a high traffic site, this represents an enormous amount of genuinely unnecessary, repeated database load, all being generated by requests asking for data that has already been correctly answered many times over in the last few minutes.
Setting up a proper persistent object cache involves provisioning a Redis or Memcached instance, installing and correctly configuring a matching WordPress object cache plugin so WordPress actually uses that external cache rather than only its default in memory one, and then, critically, auditing plugin and theme code to confirm it correctly uses WordPress’s caching API rather than bypassing it with raw, direct database queries that never touch the object cache layer at all. This last step matters more than it initially appears, because a poorly written plugin that runs raw SQL queries directly against the database, rather than going through WordPress’s standard query functions and caching wrapper functions, receives no benefit whatsoever from an object cache no matter how well configured that cache otherwise is.
Beyond the Plugin: SQL Injection Prevention at the Query Level
Custom database queries are frequently necessary on a high traffic, custom built WordPress site, since WordPress’s standard query functions do not always efficiently express the specific, complex filtering logic a real estate search or an LMS course catalog genuinely requires. The moment a development team writes custom SQL rather than relying entirely on WordPress’s built in query functions, SQL injection risk becomes a real, direct engineering responsibility rather than something WordPress core quietly handles on the team’s behalf.
SQL injection occurs when user supplied input, a search term, a filter value, a URL parameter, gets concatenated directly into a SQL query string without proper handling, allowing a malicious visitor to manipulate that input in a way that changes the query’s actual meaning and behavior. This is not a theoretical concern for a high traffic site with custom search and filtering functionality. It is one of the most common, most damaging vulnerability categories across web applications as a whole, and any custom query touching user input needs deliberate, correct protection against it.
WordPress provides the $wpdb->prepare method specifically for this purpose, using placeholder syntax that ensures user input gets properly escaped and treated strictly as data rather than as executable SQL syntax, regardless of what characters that input happens to contain. The discipline required here is straightforward to state and easy to get subtly wrong in practice: every single piece of user supplied data going into a custom query needs to pass through prepare, with no exceptions carved out for values a developer assumes are safe, since assumptions about what a value could contain are exactly the kind of reasoning that leads to a real vulnerability once an actual attacker starts deliberately testing unexpected input.
A genuine database refactor for a high traffic site includes a systematic audit of every custom query already in the codebase, not just the queries being newly written, since custom query logic accumulates over a site’s lifetime, added by different developers across different projects and different plugins, and a site that has been in active development for years frequently has custom SQL scattered across more places than anyone currently on the team fully remembers or has ever seen collected in one place.
Beyond the Plugin: Cron Job Optimization
WordPress’s built in scheduling system, commonly called WP-Cron, does not run as a genuine, independent, continuously running background process the way a traditional server level cron job does. Instead, it checks whether any scheduled task is due to run only when a visitor loads a page on the site, piggybacking scheduled task execution onto regular page load requests rather than running independently on a fixed, reliable schedule in the background.
This design works acceptably for low traffic sites, where the volume of regular page views is sporadic and irregular enough that WP-Cron’s page load triggered checks still happen frequently enough for scheduled tasks to run on something reasonably close to their intended schedule. On a genuinely high traffic site, the exact opposite problem emerges: WP-Cron’s check gets triggered on nearly every single page load, and if several tasks happen to be due around the same time, a single unlucky visitor’s page request can end up triggering multiple scheduled jobs to execute synchronously, all while that visitor is waiting for their page to actually finish loading, directly and measurably slowing down that specific request for a task that has nothing to do with what that visitor actually came to the site to do.
The standard fix is disabling WordPress’s default page load triggered cron behavior entirely and replacing it with a genuine system level cron job that calls wp-cron.php directly on a fixed, predictable schedule, completely decoupled from actual visitor traffic patterns. This ensures scheduled tasks run reliably and predictably, and just as importantly, it ensures a visitor’s page request never gets delayed by an unrelated background task that happens to be due for execution at that exact moment.
Beyond fixing when cron jobs actually run, a genuine refactor also examines what those cron jobs are actually doing, since a heavy scheduled task, one that runs an expensive report across a large dataset, regenerates a large sitemap, or synchronizes data with an external system, needs to be engineered to run efficiently and, ideally, in the background asynchronously via a proper task queue, rather than blocking anything else on the site while it executes. For a real estate portal syncing thousands of listings from an external data feed, or an LMS recalculating enrollment and progress statistics across a large user base, this specific piece of the refactor is frequently where some of the most significant performance gains on the entire site turn out to be hiding, precisely because these heavy background tasks are easy for a team to overlook when everyone’s attention is focused on the visible, customer facing pages instead.
Query Refactoring in Practice: A Concrete Example
Abstract discussion of query optimization principles is easier to apply with an actual, concrete before and after example in front of it.
Consider a real estate portal’s property search, filtering listings by a minimum price, a specific city, and a minimum number of bedrooms, then sorting the results by price. A naive implementation, built directly through WP_Query’s standard meta_query and tax_query parameters without any specific performance consideration, generates SQL that joins the posts table against postmeta multiple times, once for the price filter and once again for the bedroom count filter, plus another join against the term relationship tables for the city taxonomy, all while sorting by a meta value stored as unindexed text.
On a small dataset, a few thousand listings, this query executes quickly enough that the underlying inefficiency never becomes visible to anyone testing the site. On a dataset of several hundred thousand listings under genuine concurrent production traffic, this same query pattern can take several seconds to complete, and worse, it can consume enough database resources during that time to noticeably slow down every other query running concurrently against the same database, turning one poorly performing search page into a site wide performance problem rather than a contained, isolated one.
A proper refactor addresses this at multiple levels simultaneously rather than attempting a single isolated fix. First, the price and bedroom count meta fields get explicitly declared as numeric types in the meta_query, allowing MySQL to compare and sort them as actual numbers rather than as generic text. Second, a dedicated composite index gets added directly to the postmeta table, or in a more thorough refactor, frequently and heavily filtered fields like price get moved out of the generic postmeta entity attribute value structure entirely and into a dedicated custom table purpose built with proper typed columns and indexes designed specifically around the site’s actual, real world search patterns. Third, the taxonomy join gets reviewed to confirm it is using WordPress’s standard, already indexed term relationship tables correctly, rather than an inefficient custom implementation layered awkwardly on top of them.
The end result of a refactor like this is not a marginal, barely noticeable improvement. Moving a heavily filtered, heavily sorted field out of postmeta’s generic entity attribute value structure and into a dedicated, properly indexed table routinely turns a multi second query into one that completes in a small fraction of that time, and just as importantly, that improvement holds steady and remains reliable as the underlying dataset continues to grow, rather than gradually degrading again as listing volume increases over time the way the original unoptimized approach inevitably would.
Indexing Strategy for Custom Tables
For sites with genuinely demanding query patterns, a database refactor frequently extends beyond optimizing how WordPress’s existing tables get queried and into designing dedicated custom tables specifically built around the site’s actual, real world access patterns, rather than continuing to force increasingly complex query logic onto WordPress’s inherently general purpose default schema.
This is a deliberate, considered architectural decision rather than a default first move, since custom tables sit outside WordPress’s standard data model and require correspondingly careful, deliberate handling for compatibility with plugins, with future core WordPress updates, and with any existing site functionality that expects to interact with standard WordPress data structures. The decision to build a custom table makes sense specifically when a particular type of data, property listings with dozens of specific, well defined, and heavily and repeatedly queried attributes is a representative example, is queried frequently enough, and in complex enough combinations, that the postmeta entity attribute value structure has become a genuine, measurable, demonstrated performance bottleneck rather than a merely theoretical one.
A well designed custom table for this kind of use case uses proper typed columns, storing a price as an actual integer or decimal column rather than as generic text, and includes indexes deliberately chosen based on the site’s actual real world query patterns: which specific fields get filtered together most frequently, which fields get sorted by most often, and which specific combinations of filters show up together most commonly in genuine production traffic rather than in a developer’s initial assumptions about how the search feature will get used. Getting this indexing strategy right requires the same rigorous diagnostic process described earlier, actually observing real query patterns under real production traffic, rather than guessing at what fields deserve an index based on intuition alone.
Scaling Case Study: Real Estate Portal Architecture
Real estate portals present a particularly demanding combination of database challenges simultaneously: large volumes of structured listing data, complex multi field search and filtering functionality that needs to feel instant to the end user, frequent data updates as listings get added, sold, and removed on an ongoing basis, and frequently, integration with external data feeds and financial or mortgage calculation tools layered on top of the core listing functionality itself.
WP Scale Ops has direct, hands on experience with this specific category of project through work on MetroCuadrado.com.ve, a specialized real estate portal built to establish a trusted, professional online presence in the Venezuelan market. Projects in this category require exactly the combination of database and architecture discipline covered throughout this piece: custom post type structures genuinely designed for efficient search and filtering from the outset, rather than retrofitted onto a generic, off the shelf approach after performance problems have already surfaced in production, together with the query and indexing discipline needed to keep listing search and filtering fast as the underlying dataset continues to grow over time.
The specific architectural principles that matter for this category of site scale directly with traffic and data volume: efficient custom post type design from the very beginning of a project, meta field strategy that anticipates genuine, heavy filtering and sorting needs rather than treating every field identically regardless of how it actually gets queried in practice, and object caching configured correctly from the start rather than bolted on defensively after a specific, painful performance incident has already occurred and forced the issue. A real estate portal, or any similarly data intensive vertical like a large scale LMS platform tracking enrollment, progress, and content across thousands of courses and potentially millions of individual learner interactions, benefits enormously from this kind of deliberate architectural planning applied from the project’s actual start, rather than as a reactive, expensive fix applied only after the site has already begun struggling visibly and painfully under its own real world traffic and data volume.
What This Means for LMS and Real Estate Portals Specifically
Learning management systems and real estate portals share a specific underlying pattern that makes them both especially prone to the database problems covered throughout this piece: large volumes of structured, heavily interrelated data, combined with search, filtering, and sorting functionality that end users genuinely expect to feel instant, regardless of how large the underlying dataset has grown behind the scenes.
An LMS tracks courses, individual lessons within those courses, enrollment records, and granular progress data per user per lesson, a data model where the volume of actual rows grows multiplicatively as both course count and user count increase simultaneously, rather than growing along just one single dimension. A course catalog page filtering by subject, difficulty level, and completion status simultaneously faces precisely the same category of meta query and taxonomy join complexity described in the real estate search example earlier, and it faces exactly the same postmeta bottleneck risk once the platform’s dataset reaches genuine production scale with a meaningful number of active users.
Both verticals also share a specific pattern around personalized, dynamic content that meaningfully limits how much standard page level caching alone can actually help. A logged in learner’s course progress dashboard and a saved search or a personalized property recommendation list are both, by their very nature, unique to that specific individual user, which means they largely bypass standard page caching by design and depend instead on genuinely efficient underlying queries and a properly configured, functioning object cache layer to perform acceptably at real, meaningful scale. This is precisely why the deeper, more thorough database work covered throughout this piece matters more for these two specific verticals than it does for a comparatively simpler, more static content site, where page level caching alone frequently papers over a surprising number of underlying query inefficiencies without anyone ever noticing the difference.
Why Plugin Level Developers Cannot Fix This
It is worth being direct and specific about why this category of problem consistently falls outside what a typical WordPress maintenance provider or a general purpose plugin can realistically resolve, since understanding that boundary clearly is what actually justifies bringing in genuine engineering expertise rather than continuing to try yet another optimization plugin.
A general maintenance provider’s toolkit is built primarily around managing WordPress core, themes, and plugins: applying updates, configuring standard caching plugins, running basic security scans, and handling routine day to day site administration tasks. This work is genuinely necessary and valuable, but it operates entirely at the plugin and configuration layer, and it does not extend into reading and understanding actual custom SQL, correctly interpreting an EXPLAIN query execution plan, or making an informed, deliberate architectural decision about when a specific type of data genuinely deserves to move out of WordPress’s standard postmeta structure and into a dedicated, purpose built custom table.
A generic database optimization plugin, similarly, is built to solve a genuinely different, narrower category of problem: cleaning up accumulated post revisions, expired transients, and orphaned metadata left behind by long since deleted plugins. This kind of routine cleanup is worth doing and does provide real, if modest, benefit. It does nothing whatsoever, however, for a query that is inefficient by fundamental design, one that will remain exactly as inefficient immediately after a thorough database cleanup as it was immediately before that cleanup ran, because the actual underlying problem was never about accumulated clutter in the first place.
The specific skill set this category of work genuinely requires, reading and correctly interpreting real SQL, understanding precisely how WordPress’s internal query functions construct that SQL under the hood, correctly diagnosing genuine N plus one query patterns hidden inside plugin and theme hook logic, and making sound, well reasoned architectural decisions about custom table design, sits squarely in the domain of genuine backend engineering. This is precisely the gap between “plugin level” work and the kind of custom code level engineering a high traffic, custom built site genuinely requires once it has meaningfully outgrown what off the shelf plugins and generic maintenance work were ever designed to handle in the first place.
A Practical Audit Checklist
For a technical leader wanting to assess how significant their own site’s database performance risk actually is before commissioning a full, formal audit, a handful of specific, concrete signals are worth checking directly.
Install Query Monitor on a staging environment and load your site’s most complex, most heavily used pages, a search results page, a filtered listing view, a logged in dashboard, and look specifically for any individual query taking longer than roughly fifty milliseconds, or any single page load triggering an unusually and suspiciously large total number of separate queries.
Check whether a persistent object cache, Redis or Memcached, is actually configured and, just as importantly, actually being used correctly by your site’s specific plugins and theme code, rather than merely installed but effectively bypassed by code that queries the database directly.
Review your postmeta table’s total size directly, and specifically identify which meta keys account for the largest overall share of that table’s total row count, since these specific keys are the ones most likely to be involved in your site’s slowest, most expensive queries.
Confirm WP-Cron has been properly disabled from its default page load triggered behavior and replaced with a genuine, reliable system level cron job, particularly on any site receiving meaningful, consistent traffic volume throughout the day.
Search your active codebase, custom theme code and any custom or heavily modified plugins specifically, for direct, raw SQL queries, and confirm every single one that incorporates any form of user supplied input is correctly and consistently using $wpdb->prepare rather than directly concatenating that input into the query string.
Any one of these checks turning up a clear, concrete problem is a reasonably strong, actionable signal that the site would benefit meaningfully from a full, thorough audit rather than another round of incremental, plugin level optimization attempts.
Common Mistakes in DIY Database Optimization
A handful of well intentioned but ultimately counterproductive approaches show up repeatedly across teams attempting to solve database performance problems without dedicated backend engineering expertise directly involved in the effort.
Adding indexes indiscriminately. Indexes meaningfully speed up read queries, but they also add real overhead to every write operation, since the database has to correspondingly update every relevant index each time a row gets inserted, updated, or deleted. Adding indexes broadly and speculatively, without first specifically identifying which actual queries genuinely need them based on real, observed query patterns, can measurably slow down a busy, write heavy site rather than actually speeding it up as intended.
Treating every optimization plugin as functionally interchangeable. Different optimization plugins target genuinely different layers of the performance problem, page caching, database table cleanup, image optimization, and installing several of them simultaneously without understanding specifically what each one actually does under the hood frequently produces overlapping, sometimes directly conflicting behavior rather than any compounding, additive benefit.
Optimizing the queries that are easiest to find rather than the ones that actually matter most. A slow query on a rarely visited admin settings page matters far less, in practice, than a moderately slow query running on every single homepage load. Prioritizing fixes based on actual traffic volume and genuine real world business impact, rather than simply fixing whatever specific issue happened to be easiest to spot first, makes a measurably bigger difference for the same total amount of engineering effort invested.
Skipping load testing after a fix. A query that looks meaningfully faster in EXPLAIN output, or that performs noticeably better during a single developer’s manual test, does not automatically guarantee it will hold up equally well under genuine, realistic concurrent production load. Proper load testing after any significant change confirms a fix actually holds under real conditions, rather than merely appearing to work in an artificially low traffic testing environment.
Refactoring without establishing a genuine performance baseline first. Without first measuring specific, concrete query times and total request counts before making any changes, it becomes genuinely difficult to actually prove a given refactor delivered any real, measurable improvement, or to catch a regression early if a subsequent, unrelated change accidentally undoes some or all of that improvement later on.
Read Replicas and Multi Layer Caching at Genuine Scale
For sites operating at the very high end of traffic and data volume, query optimization and object caching alone eventually reach a ceiling, and a more sophisticated database architecture becomes worth genuine consideration. Understanding this next layer helps a technical leader recognize when a site has actually outgrown single database optimization work entirely, rather than mistaking a genuinely architectural limitation for a problem that another round of query tuning could still solve.
A read replica is a copy of the primary database that stays continuously synchronized with it and handles read only queries, search results, listing pages, course catalog browsing, while the primary database handles writes, new listings being added, enrollment records being updated, comments being posted. Because the overwhelming majority of traffic on a content heavy site is read traffic rather than write traffic, directing that read traffic to one or more replicas meaningfully reduces load on the primary database, which in turn keeps write operations fast and reliable even during periods of very heavy read traffic, a pattern real estate portals and LMS platforms both experience regularly during peak browsing hours.
Implementing read replicas with WordPress requires either a hosting platform that supports this configuration natively, or a plugin capable of routing specific queries to the appropriate database connection based on whether that query is a read or a write. This is meaningfully more involved than standard object caching setup, and it introduces new considerations around replication lag, the small delay between a write happening on the primary database and that same change becoming visible on a replica, which matters for any functionality where a user needs to see their own change reflected back immediately, such as a listing agent updating a property’s price and expecting that new price to display correctly on their very next page load.
A multi layer caching strategy at this scale typically combines several distinct layers working together: a content delivery network caching fully static assets close to the visitor geographically, a page cache for anonymous, non personalized page views, a persistent object cache handling individual query and object level caching as described earlier, and, for the very highest traffic sites, read replicas absorbing the read query load that remains after all the caching layers above have already done their work. Each layer addresses a genuinely different part of the request path, and a site experiencing serious performance problems at real scale typically needs several of these layers working correctly together, rather than any single layer configured perfectly in isolation while the others remain neglected or misconfigured.
Reaching this level of architecture is not the right starting point for every site, and recommending it prematurely, before genuinely establishing that query level and object cache level optimizations have already been thoroughly addressed first, is a common and expensive mistake. The correct sequence starts with the fundamentals: efficient queries, proper indexing, a correctly configured object cache, and disciplined cron handling. Read replicas and more elaborate multi layer caching architecture become genuinely worth the added operational complexity only once those fundamentals are solidly in place and a site’s traffic and data volume have grown to a point where those fundamentals alone are no longer sufficient on their own.
Monitoring and Maintaining Performance After a Refactor
A database refactor is not a single, one time project with a natural, permanent end point. Query patterns shift as new features ship, as content and data volume continue growing, and as traffic patterns evolve over time, which means the specific queries that were the biggest bottlenecks at the time of an initial audit are not guaranteed to remain the biggest bottlenecks indefinitely into the future.
Ongoing monitoring after a refactor should track a small, consistent set of concrete metrics rather than relying purely on subjective impressions of whether the site feels fast. Average and, just as importantly, ninety fifth percentile query response times reveal not just typical performance but how badly the worst performing requests are actually behaving, since a site can have an excellent average response time while still delivering a genuinely poor experience to a meaningful share of visitors hitting a specific slow page or an unlucky combination of filters. Total query count per page load, tracked over time rather than as a single one time snapshot, helps catch a newly introduced N plus one problem shortly after it ships in a new feature, well before it has a chance to compound into a serious, site wide performance issue. Object cache hit rate indicates whether the caching layer is actually functioning effectively as new plugins and features get added over time, since a hit rate that quietly degrades after a specific change is a strong, actionable signal that something new was added without a proper caching strategy in mind.
Establishing this kind of ongoing monitoring as a standing practice, rather than treating a refactor as a single, isolated project with a firm and final end date, is what actually prevents a site from gradually drifting back into the exact same performance problems that originally justified doing the refactor work in the first place. Database performance is not a problem that gets permanently solved once. It is a characteristic of a growing, actively developed site that needs consistent, ongoing attention as that site itself continues to evolve and grow.
What is a read replica and when does my site actually need one?
A read replica is a continuously synchronized copy of your primary database that handles read only traffic, freeing the primary database to focus on writes. It becomes worth considering once query optimization, proper indexing, and object caching have already been thoroughly addressed and a site’s traffic and data volume have grown beyond what those fundamentals alone can handle, not as a first response to a performance complaint.
How do I know if my database refactor actually worked?
Establish a concrete performance baseline before making changes, average and ninety fifth percentile query response times, total query count per page load, and object cache hit rate, then measure the same metrics again after the refactor under genuinely comparable, realistic traffic conditions. A refactor that looks better in a quick manual test but was never measured against a real baseline is difficult to actually confirm as a genuine, lasting improvement rather than a temporary or coincidental one.
Frequently Asked Questions
Why does my WordPress site slow down even though I upgraded to premium hosting?
Premium hosting increases available compute, memory, and disk resources, but it does not fix an inefficient database query. A query that scans an entire table due to a missing index still scans that entire table on faster hardware, and at real traffic volume, that inefficiency scales with your data and traffic regardless of how powerful your server is.
What is the entity attribute value problem in WordPress and why does it matter?
WordPress stores custom field data in the wp_postmeta table using a generic structure of post ID, meta key, and meta value, rather than dedicated typed columns for each specific field. This gives WordPress its flexibility for arbitrary custom fields, but it makes filtering and sorting by those fields, exactly what a real estate search or an LMS course filter needs to do, inherently less efficient than a purpose built table with proper typed columns and indexes.
How do I find out which specific database queries are actually slow on my site?
Install Query Monitor to see every query executed on a specific page load, along with exactly how long each one took and which specific code triggered it. For production level visibility across real traffic rather than a single test session, enable the MySQL slow query log to capture every query across your entire site that exceeds a defined time threshold.
What is an N plus one query problem in WordPress?
It is a pattern where a hook or function runs an additional, separate database query for every single item in a loop, rather than fetching all the needed data in one efficient, batched query upfront. A page listing twenty properties, with a callback that queries agent information separately for each individual property, turns what should be one or two total queries into twenty one separate ones, and this pattern is frequently invisible in a code review of any single function since it only becomes clear when you look at the full picture of an entire page load.
Do I need a persistent object cache like Redis for my WordPress site?
If your site has meaningful, sustained traffic and any logged in or genuinely dynamic functionality, yes. Without a persistent object cache, WordPress’s internal caching only lasts for the duration of a single page request, meaning the exact same query gets executed fresh against the database for every single page view, even when the underlying data has not changed at all since the last time it was requested.
Is WP-Cron actually running my scheduled tasks reliably?
Not necessarily, especially on a high traffic site. WP-Cron’s default behavior checks for due tasks on regular page loads rather than running as a genuine, independent background process. On a high traffic site, this can trigger multiple scheduled jobs to run synchronously during a single unlucky visitor’s page request, directly slowing down that specific page load. The standard, reliable fix is disabling this default behavior and replacing it with a real system level cron job on a fixed schedule.
When should I move data out of postmeta and into a custom database table?
When a specific type of data is queried frequently, in complex combinations, and postmeta’s generic structure has become a genuine, demonstrated, measured performance bottleneck rather than a merely theoretical concern. This is a considered architectural decision, not a default first move, and it makes the most sense for heavily and repeatedly filtered, sorted data, such as property listing prices or specifications on a real estate portal.
How do I prevent SQL injection in custom WordPress queries?
Use WordPress’s $wpdb->prepare method for every single custom query that incorporates any form of user supplied input, using its placeholder syntax so that input gets properly escaped and treated strictly as data rather than as executable SQL. This discipline needs to apply consistently to every custom query in your codebase, with no exceptions made for values a developer assumes to be safe.
Can a generic WordPress optimization plugin fix slow custom queries?
No. Generic optimization plugins primarily clean up accumulated post revisions, expired transients, and orphaned metadata, which is worth doing but addresses a fundamentally different category of problem than a query that is inefficient by design. A poorly structured query remains exactly as slow immediately after a database cleanup as it was immediately before that cleanup ran.
What database challenges are specific to real estate portals and LMS platforms?
Both involve large volumes of structured, heavily interrelated data combined with search, filtering, and sorting functionality that users expect to feel instant. Both also involve significant amounts of personalized, dynamic content, a logged in learner’s progress dashboard, a saved property search, that largely bypasses standard page caching by design, making efficient underlying queries and a properly configured object cache especially important for these two specific verticals.
How long does a genuine database refactor typically take?
This depends heavily on the scope of issues found during a proper audit and the overall size and complexity of the site’s dataset, but a thorough audit that actually identifies the specific, real bottlenecks is the necessary first step before any accurate time estimate for the refactor work itself can be given responsibly.
Will refactoring my database risk breaking my existing site?
Any genuine database level change carries real risk if done carelessly, which is exactly why a proper refactor is tested thoroughly in a staging environment first, with a solid rollback plan in place, before anything gets deployed to a live, production site.
What is the difference between plugin level maintenance and genuine engineering work on a WordPress site?
Plugin level maintenance covers updates, standard configuration, and routine administration operating within WordPress’s existing plugin and theme ecosystem. Genuine engineering work involves reading and writing actual custom SQL, correctly interpreting query execution plans, and making deliberate, informed architectural decisions, such as custom table design, that sit outside what any off the shelf plugin or generic maintenance provider is built or equipped to handle.