

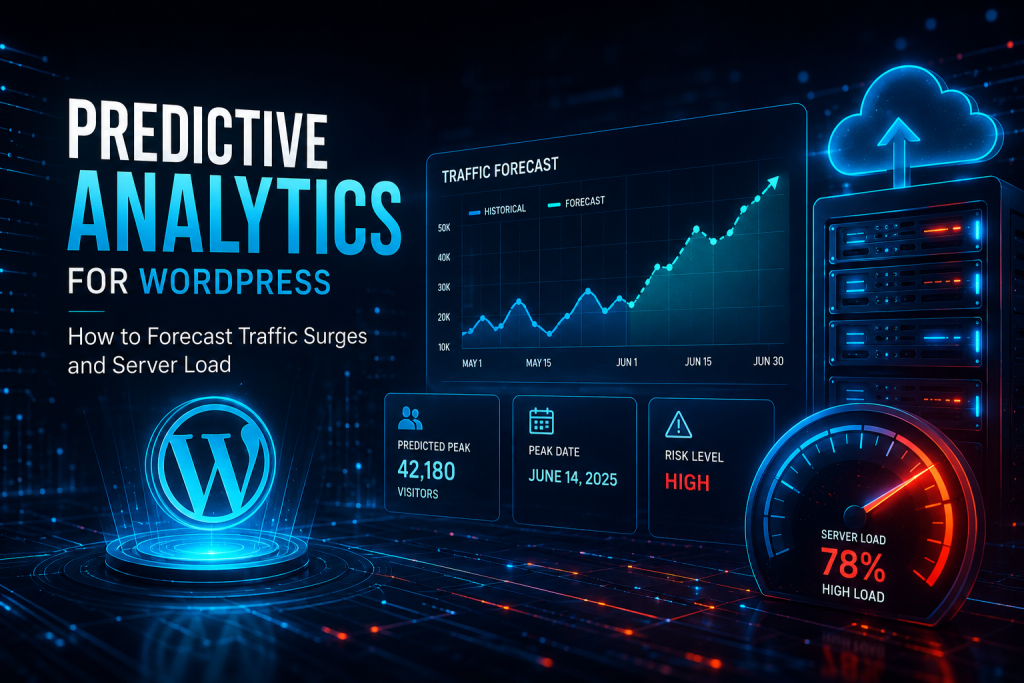
Predictive Analytics for WordPress: How to Forecast Traffic Surges and Server Load
Most WordPress performance conversations happen after something has already broken. A traffic surge hits, the server buckles, and the response is reactive, restart services, call the host, approve an emergency upgrade, and hope the problem does not recur. This article is about a fundamentally different posture. Instead of waiting for a surge to expose weaknesses that were always there, predictive performance engineering uses historical traffic data, database profiling, and deliberate load simulation to identify exactly where a high traffic WordPress platform will break before it actually breaks, and to fix that specific weakness on a calm Tuesday afternoon rather than during the exact moment the business can least afford it.
This is written for CTOs, IT managers, and owners of high traffic, custom built WordPress portals who have grown tired of a familiar cycle, a traffic spike causes a CPU crisis, the hosting provider recommends a bigger plan, the bigger plan buys a few months of relief, and the same underlying weakness resurfaces at the next spike, now at a higher cost basis. What follows explains why that cycle persists, how to actually forecast where and when a platform’s specific architecture will fail under load, and what genuine, proactive engineering, database profiling, server side logic fixes, and a properly built staging environment for safely simulating surges, looks like when applied before the crisis rather than during it.
The Fallacy of the Hosting Upgrade
Every CTO managing a high traffic WordPress platform has heard the same advice from a hosting provider at least once, and usually several times. The site is slow under load, CPU spikes during peak traffic, the database seems to be struggling. The recommended fix is almost always the same: upgrade to a larger plan, more CPU cores, more memory, a bigger database instance. This advice is not malicious, and it is not entirely wrong. It is simply incomplete in a way that costs businesses real money over time.
Why More Hardware Provides Relief Without Providing a Fix
Inefficient backend logic, an unindexed query against a custom post type, a background hook firing far more often than necessary, a metadata lookup performing several redundant database round trips, consumes server resources at a rate determined by the code itself, not by how much server capacity happens to be available. A larger server simply gives that same inefficient code more room to run before it starts causing visible problems. The underlying inefficiency is untouched. It is simply operating with a bigger cushion, for now.
This is why a hosting upgrade so reliably provides genuine, immediate relief, and why that relief so reliably proves temporary. Traffic continues growing. Content and functionality continue expanding. The same inefficient code, still running exactly as inefficiently as before, gradually consumes whatever additional headroom the upgrade purchased, and the CPU spikes and slowdowns return, typically at the next meaningful traffic surge, prompting the same recommendation to upgrade again, at a higher recurring cost, having solved nothing structural the first time around.
Why This Cycle Is Predictable, Not Random
The businesses caught in this cycle often experience it as unpredictable, a surprise crisis every few months with no obvious pattern connecting one incident to the next. In reality, the pattern is entirely predictable once the underlying mechanics are understood. Traffic surges are rarely genuinely random events. They correlate with specific, identifiable triggers, a marketing campaign launch, a seasonal demand pattern, a press mention, a product release, and a platform’s specific architectural weaknesses, whatever query or process happens to be least efficient relative to the load it experiences, will predictably be the first thing to fail whenever load crosses whatever threshold that specific weakness cannot absorb.
This predictability is precisely what makes proactive, predictive performance engineering possible in the first place. If traffic surges were genuinely random and if a platform’s failure points were genuinely unknowable in advance, there would be little alternative to reactive firefighting. Neither of these things is actually true for most businesses, which is why the remainder of this article focuses specifically on how to use historical data and deliberate testing to identify these predictable failure points before they cause a genuine incident, rather than treating every surge as an unforeseeable surprise.
Calculating the True Cost of Repeated Upgrades
It is worth being specific about what this cycle actually costs over a multi year period, since framing each individual upgrade as a modest, reasonable expense obscures the compounding financial reality. A business that upgrades its hosting tier every six to twelve months, each time in response to the same underlying inefficiency continuing to consume whatever additional capacity was most recently purchased, is effectively paying a permanent, escalating tax on code that has never actually been fixed. Reviewing a hosting cost history over several years against this pattern frequently reveals a cumulative cost that substantially exceeds what a genuine, one time database and code level investigation and remediation effort would have cost, a comparison covered in more depth in our broader guidance on server resource optimization and the hosting upsell pattern specifically.
Why Hosting Providers Consistently Recommend the Wrong Fix
This is not primarily a matter of hosting providers acting in bad faith. Most hosting providers, even genuinely reputable ones, are structured around selling and supporting server capacity, and their support teams are generally well equipped to confirm that resource limits are being reached and recommend an appropriate upgrade to address that specific symptom. They are not typically equipped, or incentivized, to dig into a customer’s specific custom plugins, custom post type queries, or background processing logic to determine whether that resource consumption reflects genuine, unavoidable growth or fixable inefficiency. This structural gap means a business relying solely on hosting provider guidance will, almost by default, receive capacity focused recommendations, regardless of whether a code level fix would actually resolve the underlying problem more effectively and more permanently.
Reading Historical Traffic Data as a Forecasting Tool
Before any code level investigation begins, a genuinely predictive approach starts with a business’s own historical traffic and analytics data, treated not simply as a record of what happened, but as a genuine forecasting resource. Reviewing traffic patterns across the past several years typically reveals recurring, identifiable rhythms, a specific seasonal period that consistently drives elevated traffic, a recurring pattern tied to a regular marketing cadence, a predictable spike whenever a certain category of content gets published. These patterns are rarely examined systematically outside of marketing reporting, yet they represent exactly the raw material a technical team needs to forecast, with real specificity, when the platform is likely to face its next serious load test, well before that specific moment actually arrives.
This historical review also reveals which specific pages and which specific site functionality tend to bear the brunt of a given category of surge, since a surge driven by a viral piece of content concentrates load very differently than a surge driven by a checkout heavy promotional campaign. Understanding this distinction in advance, from a business’s own historical pattern rather than generic assumption, allows the profiling and testing work described throughout the rest of this article to be targeted specifically at the pages and processes most likely to matter during the next real, forecasted event.
Correlating Marketing Calendars With Technical Readiness
A genuinely mature predictive practice connects a business’s own marketing and business calendar directly to its technical readiness planning, treating an upcoming product launch, a planned advertising campaign, or a known seasonal promotion as a scheduled technical event deserving its own specific preparation, not simply a marketing initiative the technical team learns about only once traffic has already begun climbing. This kind of coordination, marketing and engineering sharing visibility into what is coming and when, is precisely what allows the profiling, optimization, and load testing described throughout the remainder of this article to be scheduled deliberately ahead of a known event, rather than scrambled together reactively once a surge has already begun.
Database Query Profiling and Bottlenecks
Breaking the upgrade cycle requires identifying, with precision, exactly which pieces of a platform’s actual code and database queries are responsible for its specific vulnerability to traffic surges. This is genuine diagnostic work, not a generic checklist applied uniformly regardless of a platform’s specific architecture.
Why Guessing at the Cause Wastes Time During a Crisis
When a site is actively struggling under load, the instinct is to act quickly, deactivating a plugin with a reputation for causing issues, adding a generic caching layer, restarting services. These actions sometimes help, but they frequently fail to address the actual root cause on a genuinely custom, complex platform, because that root cause is often specific to the platform’s own custom post types, custom fields, and business logic, not a generic, widely known issue a general troubleshooting checklist would reliably catch. Time spent on generic fixes during an active crisis delays the point at which the genuine problem gets identified, all while the business continues absorbing the cost of the ongoing incident.
Profiling Custom Post Type Queries Under Realistic Load
Custom post types are frequently where the most severe, least visible performance bottlenecks live on a genuinely custom WordPress platform, since queries against custom post types often involve additional complexity, filtering by custom taxonomy, sorting by custom field values, that a standard WordPress installation rarely exercises as heavily. Proper profiling uses real diagnostic tooling to measure exactly how long specific custom post type queries take to execute under realistic, representative load, not just under the light, low traffic conditions a query might have originally been tested against during initial development.
This distinction matters enormously, since a custom post type query that performs acceptably against a few hundred sample posts during development can degrade sharply once that same query runs against tens of thousands of posts under genuine production traffic, a gap that only becomes visible through deliberate profiling against realistic data volume and realistic concurrent load, exactly the kind of testing a rushed, reactive troubleshooting session during an active incident rarely has time to perform properly.
Diagnosing Dynamic Metadata Table Lookups
WordPress stores custom field data in a shared, generically structured metadata table, and any page or process that needs to check several custom field values, verifying a user’s membership tier, checking a product’s availability status, evaluating a piece of business logic dependent on several custom attributes, often triggers multiple separate lookups against this same shared table. Under light traffic, this overhead is negligible. Under a genuine surge, with many simultaneous requests all triggering the same pattern of metadata lookups simultaneously, this shared table can become a genuine bottleneck, with read and write contention against the same underlying structure degrading performance for every request depending on it.
Identifying this specific pattern requires profiling tooling capable of tracing exactly which metadata lookups are occurring most frequently and at what cumulative cost, surfacing the specific custom fields and specific business logic responsible, rather than a generic database performance report that only reports aggregate query volume without attributing that volume to its actual, specific source within the platform’s custom logic.
Auditing Unoptimized Background Hooks
WordPress’s hook and filter system allows custom code and plugins to register logic that runs at specific points during every request, and on a complex, custom developed platform, this accumulated hook logic frequently represents a significant, underappreciated source of load, particularly hooks that fire on every single page load regardless of whether their specific functionality is actually relevant to that particular request. A background hook performing an expensive calculation, an external API call, or a redundant database query on every page load, rather than only in the specific contexts where its functionality is genuinely needed, multiplies its cost directly with total traffic volume, becoming a genuine bottleneck precisely during the highest traffic moments when that multiplied cost matters most.
A thorough audit maps out exactly which hooks fire most frequently and at what individual and cumulative cost, distinguishing between hooks that are properly scoped to only the contexts where they are genuinely needed and hooks that run unconditionally, consuming resources on every request regardless of relevance, a pattern explored in considerably more depth throughout our broader guidance on hook and filter architecture in complex themes.
Building a Baseline for What Normal Actually Looks Like
Genuine profiling work is most valuable when it establishes a clear, quantified baseline for what a platform’s typical, healthy resource consumption pattern actually looks like under normal traffic, providing a reference point against which future anomalies and surges can be measured and understood. Without this baseline, a team responding to a live incident has no clear way to distinguish genuinely abnormal, problematic resource consumption from a simple, expected increase in load proportional to increased legitimate traffic. Establishing this baseline early, before an incident occurs, is a foundational part of the predictive approach this article advocates throughout, transforming vague concern into specific, measurable understanding of exactly how a platform’s resource consumption scales as traffic grows.
Identifying the Specific Traffic Threshold Where Each Bottleneck Breaks
Beyond simply identifying which queries and hooks are the most expensive in absolute terms, genuinely predictive profiling determines the specific concurrency or traffic threshold at which each identified bottleneck transitions from a minor, tolerable cost into a genuine, visible failure point. A query that adds a small amount of overhead per request might be entirely unnoticeable at typical traffic levels, but if that overhead compounds severely once concurrent requests cross a specific threshold, perhaps due to database table locking or connection pool exhaustion, knowing that specific threshold in advance transforms an abstract performance concern into a concrete, quantified capacity limit.
This threshold specific knowledge is precisely what allows a technical team to answer a question that matters enormously to business stakeholders planning a major campaign or launch, specifically how much traffic the current platform can genuinely absorb before a specific, known bottleneck becomes the limiting factor, rather than a vague, unquantified sense that the platform is probably fine or probably at risk. Determining these thresholds requires the kind of deliberate load testing described later in this article, incrementally increasing simulated concurrent traffic against a staging environment while monitoring exactly where and when a specific, previously identified bottleneck begins to degrade meaningfully.
Distinguishing Genuine Growth From Fixable Inefficiency in Historical Resource Trends
Reviewing a platform’s historical resource consumption trend over time, rather than only examining a single snapshot, reveals an important distinction that a one time profiling session alone might miss. Some resource consumption growth genuinely reflects legitimate business growth, more content, more users, more genuine transactions, and represents capacity that a business should expect to need and should plan to provision for accordingly. Other resource consumption growth reflects gradually worsening inefficiency, a query whose execution time degrades disproportionately as a specific table grows past a certain size, a background process whose frequency was never adjusted as the platform’s underlying data volume expanded well beyond what that process was originally designed to handle efficiently.
Distinguishing between these two categories, legitimate growth requiring genuine additional capacity and fixable inefficiency requiring code level remediation, is precisely the analytical work that separates genuinely predictive performance engineering from a purely reactive posture that simply treats every resource consumption increase as justification for the next hosting upgrade, regardless of whether that increase actually reflects unavoidable growth or a specific, addressable inefficiency quietly worsening in the background.
Proactive Resource Optimization
Once profiling has identified a platform’s specific bottlenecks, the remediation work involves targeted, technical fixes addressing those specific weaknesses directly, alongside broader infrastructure improvements that reduce a platform’s overall vulnerability to sudden load regardless of which specific piece of code happens to be involved.
Disabling the Default Virtual Cron for a Proper System Level Cron
WordPress, by default, does not use a genuine, scheduled system cron job to run its background tasks, publishing scheduled posts, checking for updates, running scheduled plugin tasks. Instead, it uses what is commonly called WP Cron, a virtual scheduling mechanism that checks whether any scheduled task is due to run every time a visitor loads a page on the site. Under normal, moderate traffic, this approach works adequately. Under genuine traffic surge conditions, this default behavior becomes a direct, measurable liability, since every single page load, potentially thousands occurring simultaneously during a surge, triggers this same WP Cron check, adding a real, cumulative processing cost precisely during the moment a platform can least afford any additional unnecessary overhead.
The proper fix is disabling this default virtual cron behavior entirely and replacing it with a genuine, properly scheduled system level Linux cron job, running on a fixed, predictable schedule independent of visitor traffic entirely. This single change removes an entire category of load that scales directly and unnecessarily with traffic volume, converting an unpredictable, traffic dependent background task overhead into a fixed, predictable, and considerably smaller resource cost running on its own independent schedule.
Implementing Advanced Object Caching With Redis or Memcached
Once the specific queries and hooks responsible for a platform’s heaviest resource consumption have been identified through profiling, object caching, using a dedicated system like Redis or Memcached, provides a direct, powerful mechanism for reducing how often those expensive operations actually need to execute. Rather than recalculating an expensive custom post type query or a metadata lookup from scratch on every single request, object caching stores the result and serves that cached result to subsequent requests within an appropriately calibrated cache lifetime, dramatically reducing the actual database and CPU load a surge in traffic generates, even though the underlying code itself remains unchanged.
Properly configuring object caching for a genuinely custom platform requires deliberate attention to which specific data actually benefits from caching, and for how long, based on how frequently that specific data actually changes and how critical immediate accuracy is for that specific use case, exactly the kind of granular, calibrated configuration described in considerably more depth throughout our broader guidance on server resource optimization, applied here specifically as a defensive measure against the resource spikes a genuine traffic surge produces.
Restructuring the Specific Queries and Hooks Profiling Identified
Beyond caching, the profiling work described in the previous section frequently surfaces specific opportunities for direct code level fixes, adding proper database indexing to a custom post type query that was never indexed with genuine production scale in mind, consolidating several separate metadata lookups into a single, efficient combined query, or scoping an overly broad background hook so that it only executes in the specific contexts where its functionality is genuinely relevant rather than unconditionally on every single page load. These fixes address the root cause directly, permanently reducing the actual resource cost of the platform’s core functionality, rather than simply caching around an inefficiency that remains present in the underlying code.
Load Balancing and Horizontal Scaling for Platforms That Have Genuinely Outgrown a Single Server
For the largest, most genuinely high traffic platforms, code level optimization and caching alone eventually reach a point where further improvement requires architectural scaling beyond a single server, distributing traffic across multiple application servers behind a load balancer, allowing the platform to absorb genuinely larger traffic volumes than any single server, however well optimized, could reasonably handle alone. This represents a more substantial infrastructure investment than the code level fixes described above, and is generally most relevant specifically for platforms that have already implemented thorough code level optimization and object caching and have confirmed, through the kind of load testing described in the next section, that genuine architectural scaling, not further code optimization, represents the actual remaining bottleneck.
Prioritizing Fixes by Genuine, Measured Impact
A disciplined proactive optimization effort prioritizes remediation work according to the actual, measured impact each specific fix is likely to deliver, based directly on the profiling data gathered earlier, rather than addressing whatever inefficiency happens to be easiest to fix first or most intuitively suspicious without hard data behind that intuition. This prioritization ensures that limited engineering time is spent first on the specific bottlenecks genuinely most likely to cause a failure during the next real traffic surge, maximizing the practical, defensive value of the optimization effort relative to the engineering time actually invested.
Reactive Hosting Upgrades Versus Predictive Performance Engineering
| What You Care About | Reactive Hosting Upgrades | Predictive Performance Engineering |
|---|---|---|
| When the problem is addressed | After a crisis has already occurred | Before a forecasted surge arrives |
| Root cause of the bottleneck | Untouched, simply given more room | Identified and fixed directly |
| Cost pattern over time | Recurring, escalating monthly cost | One time engineering investment |
| Confidence ahead of a known event | Hope, based on the last upgrade | Measured, based on simulated load testing |
| Background task overhead | Default WP Cron scaling with traffic | Fixed cost system level cron job |
| Risk during the next surge | Same underlying weakness remains | Verified capacity against a known threshold |
DevOps Security Buffer
Identifying and fixing bottlenecks is only half of a genuinely predictive approach. The other half involves actually testing a platform’s behavior under realistic surge conditions before that surge happens for real, using a properly isolated staging environment and disciplined deployment practices to confirm that fixes genuinely work and that new changes do not introduce new vulnerabilities, all without any risk to the live, production platform.
Why Testing on Production Is Never an Acceptable Option
It might seem tempting to simply monitor the live production platform closely and respond quickly whenever a real surge begins to strain it. This reactive posture, however attentive, cannot substitute for genuine, deliberate testing, since it means a platform’s actual breaking point is only discovered in real time, in front of real visitors and real revenue, precisely the outcome this entire article is specifically focused on avoiding. Genuine confidence that a platform can withstand a forecasted surge requires testing that surge’s approximate conditions deliberately, in an environment where a failure teaches the engineering team something valuable without costing the business anything in lost revenue or damaged trust.
Building a Staging Environment That Genuinely Mirrors Production
A staging environment used specifically for load testing needs to closely mirror the production environment’s actual configuration, server specifications, database size, plugin versions, in order for load testing results to genuinely reflect how the live platform will actually behave under similar conditions. A staging environment that differs meaningfully from production, running on a smaller server, populated with only a small fraction of production’s actual data volume, produces load testing results that create false confidence, since the specific bottlenecks that only emerge at genuine production scale and configuration may simply never surface during testing against an environment that does not adequately replicate those specific conditions.
This fidelity requirement connects directly to the broader discipline of proper staging environment practice described throughout our guidance on professional Git workflows and deployment, where the same staging environment used for routine update testing serves double duty as the environment where surge simulation and load testing happen safely, without any risk to the live platform visitors are actively depending on.
Simulating Realistic Surge Conditions Deliberately
Genuine load testing involves deliberately generating traffic against the staging environment that approximates the specific pattern a forecasted real surge is expected to follow, not simply generating an arbitrary volume of generic traffic. A platform expecting a surge driven by a scheduled marketing campaign benefits from testing against a traffic pattern that specifically simulates that campaign’s expected volume and the specific pages that campaign is expected to drive traffic toward, exercising the exact code paths, checkout flows, specific landing pages, form submissions, that the actual, forecasted surge will exercise for real, rather than a generic load test that exercises the platform’s typical, average traffic pattern without specifically probing the particular pages and processes most likely to be stressed by the specific surge being forecasted.
Testing Deployment Safety Under Load
Beyond testing whether a platform can absorb a forecasted surge’s raw traffic volume, a genuinely thorough testing process also confirms that any code changes intended to address identified bottlenecks, the query optimizations, the caching configuration, the cron fix, actually deliver their intended improvement when tested under the same simulated load conditions, verified in staging before that change is deployed to the live production platform through the same disciplined, version controlled deployment process described throughout our broader guidance on Git workflows and zero downtime deployment. This closes the loop between identifying a bottleneck, fixing it, and confirming that fix genuinely works under realistic conditions, all before the live platform’s actual visitors and actual revenue are ever put at risk by an unverified change.
Using Git History as a Safety Net During High Stakes Optimization Work
Because proactive performance optimization frequently involves meaningful changes to core, business critical logic, database queries, caching configuration, background processing, this work benefits directly from the same disciplined version control practices described throughout our broader guidance on professional deployment, ensuring every change is tracked, reversible, and deployed through a controlled, staged process. If a specific optimization, despite thorough staging testing, produces an unexpected issue once deployed to production, a proper Git history allows an immediate, precise rollback to the last known good state, rather than a stressful, manual attempt to reconstruct what the code looked like before the change, precisely the kind of safety net that makes ambitious, proactive optimization work genuinely low risk to undertake.
What This Looks Like in Practice
Consider a growing media publisher whose WordPress platform has experienced repeated, severe slowdowns whenever a specific article goes viral, driving a sudden, sharp spike in traffic that has, on more than one occasion, taken the entire site offline for several hours, directly during the exact moment the publisher’s advertising revenue and audience growth potential are highest. Previous responses to these incidents had focused entirely on emergency hosting upgrades, purchased reactively during or immediately after each incident, without any underlying investigation into why the platform specifically struggled under this particular kind of traffic pattern.
A proactive engineering engagement begins with historical traffic analysis, confirming that viral traffic surges follow a predictable pattern, a sharp spike concentrated heavily on the specific article page and the site’s homepage, with comment submission and related article recommendation functionality experiencing disproportionate load during these specific events. Database profiling reveals that the related article recommendation feature runs an unindexed custom post type query on every single page load, and that this specific query’s execution time had been quietly degrading for months as the publisher’s total article count grew, a degradation invisible during normal traffic but severely compounded during a genuine surge. Remediation includes properly indexing this query, implementing object caching specifically for recommendation results, and disabling the default WP Cron behavior in favor of a proper system level cron job. The fix is then tested directly in a staging environment configured specifically to simulate the traffic pattern and volume of the publisher’s largest previous viral spike. The following genuine viral traffic event, driving a comparable spike to the incidents that had previously taken the site offline, is absorbed without any degradation in site performance, allowing the publisher to fully capture the advertising revenue and audience growth that previous incidents had specifically prevented.
A Second Scenario: Preparing a B2B Platform for a Known Product Launch
Consider a different case, a B2B SaaS company running a custom WordPress marketing site, planning a major product launch expected to be featured in several industry newsletters and to drive a significant, largely predictable spike in traffic to a specific set of landing pages over a known, several day window. Rather than waiting to see what happens and reacting if the site struggles, the technical team treats the launch date as a scheduled technical event, working backward from that date to complete profiling, optimization, and load testing well in advance.
Historical traffic data from previous, smaller launches reveals that the site’s lead capture form processing, involving several synchronous third party API calls, had been the slowest performing component during past, smaller traffic increases. Profiling confirms this component as the platform’s most significant bottleneck under concurrent load. The team restructures the form processing to complete these third party calls asynchronously, implements object caching for the marketing site’s most heavily trafficked landing pages, and configures a proper system level cron job to replace the platform’s default WP Cron behavior. A staging environment, configured to mirror production and populated with a realistic volume of test form submissions, is used to simulate a traffic pattern matching the specific volume the marketing team is forecasting based on comparable past campaigns and their media placement commitments. The actual launch, when it arrives, drives traffic meaningfully higher than any previous campaign the company had run, and the platform absorbs it without incident, converting what the team had specifically forecasted and prepared for into a smooth, successful launch rather than a repeat of the smaller performance struggles previous, less prepared launches had experienced.
A Checklist for CTOs and IT Managers
For technical leaders trying to determine whether their own platform carries this specific kind of unaddressed risk, a few direct questions help surface the answer. Has the platform ever experienced a severe slowdown or outage specifically during a traffic surge, a marketing campaign, a press mention, a viral moment, rather than during typical, steady traffic. Has the hosting plan been upgraded more than once within the past two years primarily in response to performance complaints rather than a clearly, independently verified increase in legitimate traffic. Has any profiling ever been performed specifically to identify which custom post type queries, metadata lookups, or background hooks consume the most resources under realistic load, or has every past troubleshooting effort relied on generic guesswork. Does the platform still rely on the default WP Cron behavior rather than a properly configured system level cron job. And has the platform’s actual behavior under a deliberately simulated traffic surge, matched to a realistic forecasted pattern, ever actually been tested in a properly configured staging environment before a genuine surge occurs.
A single yes among these questions indicates a specific, addressable risk. Multiple yes answers, particularly a documented history of incidents specifically during traffic surges combined with no history of deliberate load testing, indicate that the platform’s current approach to performance is fundamentally reactive rather than predictive, and would benefit substantially from the kind of proactive profiling, optimization, and staged load testing described throughout this article.
Frequently Asked Questions About Predictive Performance Engineering
How far in advance can a traffic surge genuinely be forecasted
Forecasting accuracy depends considerably on the specific trigger driving the anticipated surge. A scheduled marketing campaign, a planned product launch, or a known seasonal demand pattern can be forecasted with meaningful precision well in advance, allowing testing and optimization to be completed comfortably before the event. Organic, unplanned surges, a viral social media moment, an unexpected press mention, cannot be forecasted with the same specific precision, which is precisely why the profiling and optimization work described throughout this article focuses on identifying and fixing a platform’s specific underlying weaknesses generally, ensuring resilience against surge conditions broadly rather than depending entirely on advance notice of any single specific triggering event.
Is load testing against a staging environment genuinely representative of how the live production site will behave
Load testing accuracy depends directly on how closely the staging environment mirrors production in configuration, data volume, and server specifications, exactly the fidelity requirement described earlier in this article. A staging environment built and maintained specifically with this fidelity in mind produces genuinely representative, trustworthy load testing results, while a staging environment that differs meaningfully from production in these respects risks producing misleadingly reassuring results that do not actually confirm how the live platform will behave under equivalent real world conditions.
Does disabling the default WP Cron behavior risk breaking scheduled tasks like publishing scheduled posts
Properly implemented, replacing the default virtual cron with a genuine system level cron job improves the reliability of scheduled tasks rather than risking them, since a system level cron runs on its own independent, guaranteed schedule rather than depending on a visitor happening to load a page at the right moment to trigger the check. This change needs to be implemented and tested carefully, confirming the system level cron job is properly configured with the correct schedule and correct execution permissions, but done correctly, it represents a genuine reliability improvement alongside its performance benefit.
How often should database profiling and load testing be repeated once an initial optimization effort is complete
Given that a platform’s content volume, custom functionality, and traffic patterns continue evolving over time, periodic re profiling, particularly following significant new feature development or a meaningful, sustained increase in overall traffic, helps ensure that newly introduced inefficiency does not gradually erode the benefit of an initial optimization effort. Many businesses benefit from treating this as an ongoing discipline rather than a single project, revisiting profiling and load testing on a regular cadence or specifically ahead of any known, upcoming high stakes traffic event.
How does this kind of predictive engineering fit within an ongoing support relationship rather than a single audit
Traffic patterns, content volume, and custom functionality all continue to change as a business grows, meaning the specific bottlenecks profiling identifies today will not necessarily represent the platform’s specific weaknesses a year from now. This ongoing need for periodic re profiling, continued load testing ahead of known future events, and continued refinement of caching and database optimization fits naturally within a resolution based, ongoing engineering relationship, giving a growing platform continuous access to this level of specialized performance engineering expertise as its traffic and complexity continue to evolve, rather than treating proactive performance work as a single, isolated project with no planned follow through.
What tools are actually used to profile database queries and server resource consumption on a WordPress platform
Genuine profiling relies on a combination of database level tools capable of reporting on query execution time and query patterns directly, application level profiling that instruments the WordPress execution flow to measure time spent in specific hooks and functions, and server level monitoring tracking CPU, memory, and I/O consumption correlated against specific requests and time periods. The specific combination of tools appropriate for a given platform depends on its particular hosting environment and technology stack, but the underlying discipline, measuring precisely rather than guessing, remains consistent regardless of which specific tools are used to gather that measurement.
Can predictive performance engineering genuinely prevent every possible outage, or does some residual risk always remain
No engineering effort can eliminate risk entirely, since a genuinely unprecedented surge, larger or differently shaped than anything reflected in historical data or anticipated through known upcoming events, remains possible. What predictive performance engineering genuinely accomplishes is eliminating the specific, identifiable, and preventable risk that a known, profiled bottleneck causes an outage during a forecasted or generally elevated traffic event, which represents the overwhelming majority of the actual incidents most high traffic WordPress platforms experience in practice, even though it cannot claim to guarantee protection against every conceivable, genuinely unprecedented scenario.
How does load testing in staging avoid accidentally affecting real users or real data
Properly configured load testing runs specifically against an isolated staging environment, entirely separate from the live production database and production traffic, meaning simulated load and test data never reach real visitors or affect real, live business data in any way. This isolation is precisely why building and maintaining a properly configured, production mirroring staging environment, described in more depth throughout our broader guidance on Git workflows and deployment practices, represents a foundational prerequisite for genuinely safe, realistic load testing, rather than a nice to have convenience.
Is predictive performance engineering only relevant for very large, high traffic platforms, or does a smaller, growing business benefit as well
The underlying discipline, profiling before optimizing, testing before deploying, forecasting based on historical and known upcoming events rather than reacting only after a crisis, benefits any business planning genuine growth, regardless of current scale. A smaller platform with modest current traffic but ambitious, specific growth plans, a known upcoming campaign, an expected seasonal surge, benefits directly from applying this same predictive discipline proactively, before that anticipated growth arrives, rather than waiting until the platform has already scaled substantially on an unexamined, potentially fragile foundation.
Server Crashes Cost Revenue and Reputation
A hosting upgrade purchased in response to a traffic surge provides real, immediate relief and solves nothing structural, which is precisely why the same crisis tends to recur, at a higher cost, the next time meaningful traffic arrives. Genuine resilience against traffic surges comes from treating performance as a predictable, forecastable engineering problem rather than an unpredictable emergency, profiling a platform’s actual custom post type queries, metadata lookups, and background hooks to identify specific weaknesses, fixing those weaknesses directly through targeted server side logic changes and properly configured caching, and confirming the fix genuinely works by simulating realistic surge conditions in a properly isolated staging environment before a real surge ever puts the live platform at risk. Don’t wait for your next traffic spike to break your site.
Turning a Reactive IT Function Into a Predictive Engineering Discipline
The shift this article describes throughout is ultimately a shift in posture, not just a specific set of technical fixes. A reactive IT function waits for monitoring alerts and customer complaints to signal a problem, then scrambles to diagnose and resolve it under pressure, typically defaulting to whatever fix is fastest to implement rather than whatever fix genuinely addresses the root cause. A predictive engineering discipline instead treats performance risk as something to be actively forecasted, measured, and addressed on a deliberate schedule, using historical data and known upcoming business events to determine when and where to focus profiling and testing effort, well ahead of the moment that effort actually matters.
This shift changes how a technical team’s time gets spent. Instead of a disproportionate share of engineering time going toward emergency firefighting during and immediately after a crisis, time that is stressful, expensive, and produces reactive fixes under pressure, that same time gets redirected toward calm, deliberate profiling and testing work performed well in advance, producing more thorough, better tested fixes at a lower overall cost, precisely because the work happens on a predictable schedule rather than as an unplanned emergency response.
Why This Requires Genuine Engineering Partnership, Not a One Time Consultation
Predictive performance engineering, done properly, is not a single audit that produces a static report and then concludes. A platform’s traffic patterns, content volume, and custom functionality all continue evolving, meaning the specific bottlenecks and thresholds identified today will shift over time as the platform itself changes. Genuine, lasting protection against traffic surge related outages requires an ongoing relationship with engineers who understand the platform’s specific architecture deeply enough to reprofile, retest, and refine its defenses on a continuing basis, treating performance resilience as a maintained discipline rather than a project with a defined end date after which the platform is simply assumed to remain protected indefinitely regardless of how much it continues to grow and change.
Starting Before the Next Crisis, Not After It
The businesses that get the most value from this kind of engineering investment are consistently the ones that begin before their next serious incident, not after it. Every business running a high traffic, custom WordPress platform has some forecastable event on its horizon, a known upcoming campaign, a predictable seasonal pattern, simply the ongoing, gradual growth trajectory the business is already on. Treating the profiling, optimization, and load testing described throughout this article as work to be done proactively, ahead of that next known or anticipated event, rather than as a response to whatever incident happens to occur next, is precisely what allows a business to convert its next major traffic milestone into a genuine success rather than the latest entry in a long, expensive history of reactive hosting upgrades that never actually solved the underlying problem.
Server Crashes Cost Revenue and Reputation
Don’t wait for your next traffic spike to break your site. Consult with our engineering partners to implement proactive WP Server Resource Optimization today.