


Core Web Vitals 2026: The Technical Checklist for 100/100 Scores
By WPscaleops.com | Lead Performance Engineering Team
Every serious site owner needs a wordpress core web vitals fix strategy in 2026. In 2026, 99/100 is the first place for losers. As Google’s AI crawlers become more aggressive, the margin for error in your Core Web Vitals has shrunk to zero. Therefore, if your Largest Contentful Paint is over 1.5 seconds, you are not just slow — you are invisible.
The 2026 100/100 Benchmark: A Lighthouse score of 100 demands a combination of <1.2s LCP, <50ms INP, and 0.0 CLS. Furthermore, this is achieved exclusively through server-side rendering, aggressive asset minification, and main-thread offloading. That is your target. Everything below is the protocol to reach it.
The State of the Web in 2026: A Clinical Assessment
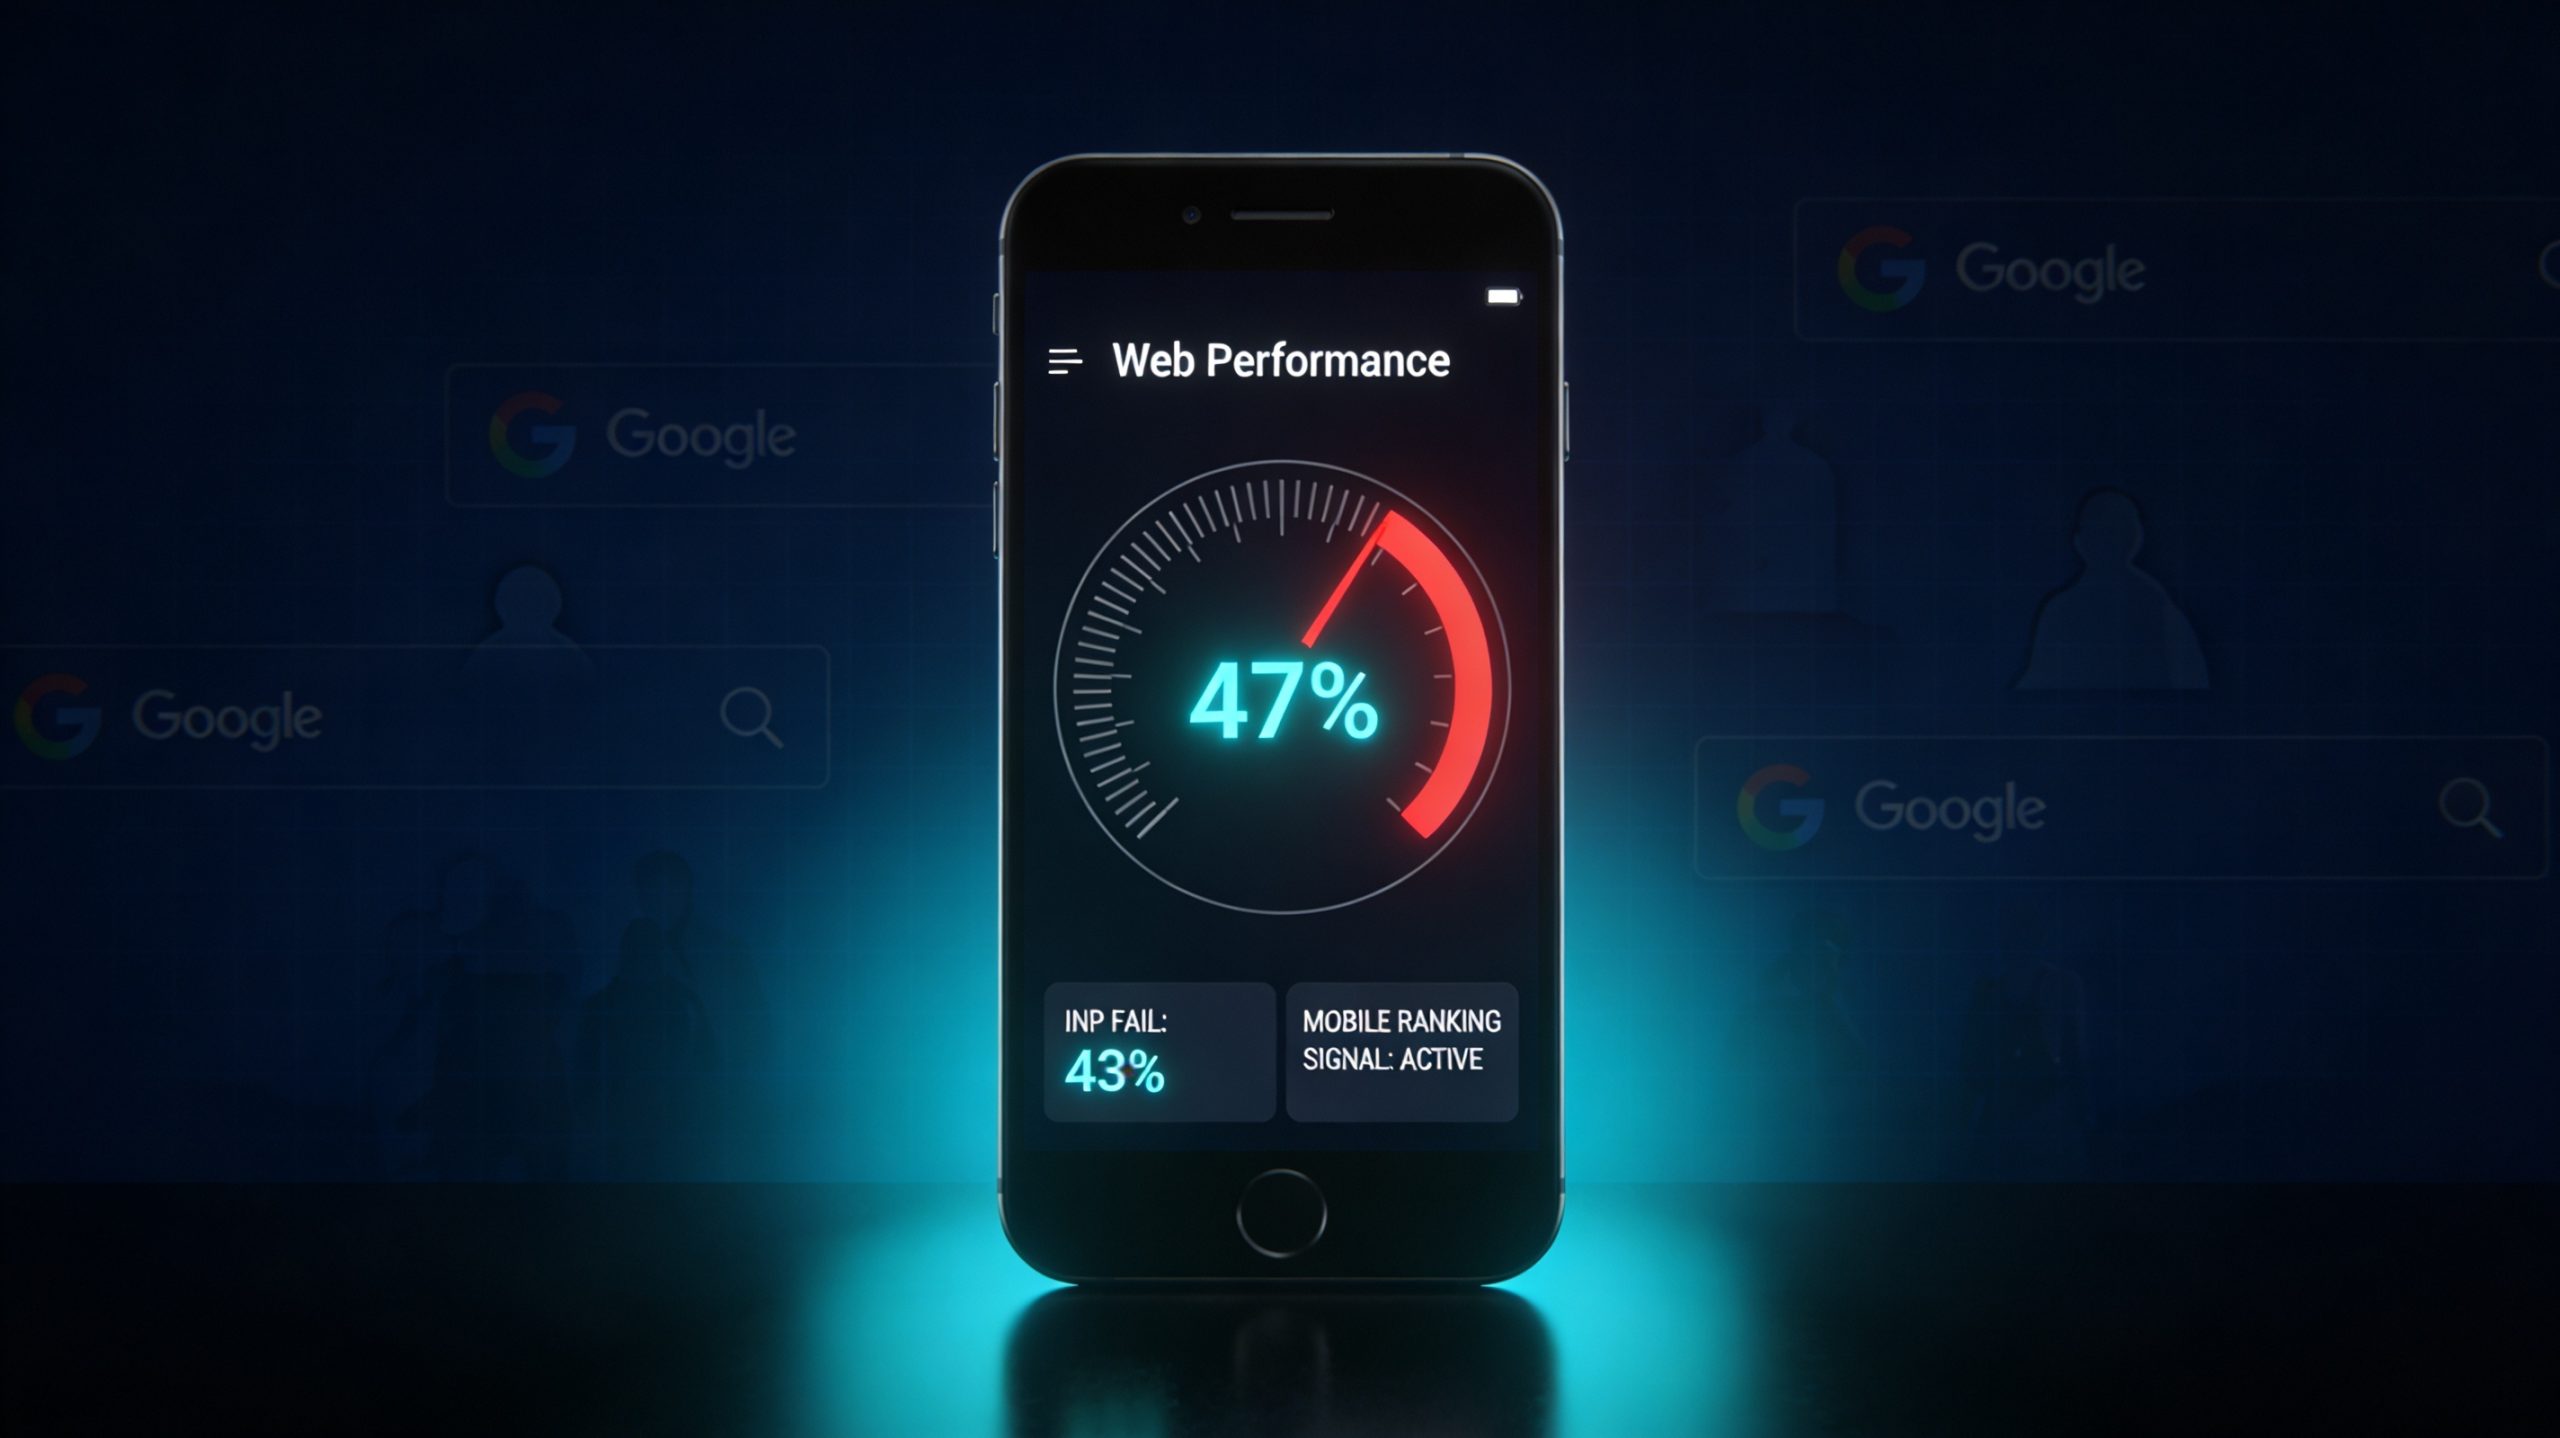
Only 47% of sites reach Google’s “good” thresholds in 2026. Consequently, the remaining 53% lose between 8% and 35% of conversions, traffic, and revenue. This makes a proper wordpress core web vitals fix not optional — it is a revenue requirement.
43% of sites still fail the 200ms INP threshold, making INP the most commonly failed Core Web Vital in 2026. This is not an SEO footnote. Instead, it is a structural failure in how most engineering teams approach JavaScript architecture.
Google evaluates these metrics at the 75th percentile of real visitor data. Therefore, your score is not what your MacBook Pro records in a fiber-connected DevTools session. In 2026, over 60% of Google searches happen on mobile. Moreover, Google now uses mobile scores as the primary ranking signal, including for desktop results. Even if your site is ultra-fast on a MacBook Pro with fiber internet, it is the performance on a mid-range Android smartphone on 4G that determines your position in search results.
The margin has been eliminated. Let us build accordingly. For additional context on Google’s ranking signals, see Google’s official Core Web Vitals documentation.
Section 1: INP — The Main-Thread Bottleneck Is Your Primary Enemy
Why INP Is the Hardest WordPress Core Web Vitals Fix to Engineer

INP replaced FID as the responsiveness metric. Interaction to Next Paint measures the full lifecycle of an interaction, not just input delay. INP captures something FID never did — the sustained responsiveness of your entire page, not just the first interaction.
INP measures the 98th percentile of interactions. This means if you have 100 user interactions, the 98th slowest one counts toward your INP score. This is crucial because real-world usage involves multiple interactions. A user might click a button, then a dropdown, then a checkbox, then submit a form. If the site gets slower with each interaction, that is now measurable and impacts your user experience rating.
This is what makes INP brutal. Fixing INP requires deep JavaScript architecture changes. You cannot simply compress an image or enable a cache. Instead, you need to rethink how your code handles user events.
INP consists of three phases: Input Delay (waiting for event handler), Processing Time (running event handler), and Presentation Delay (rendering visual update). Most engineers optimize one. However, a 100/100 wordpress core web vitals fix protocol optimizes all three simultaneously.
Understanding the Three-Phase INP Anatomy
[User Action] → [Input Delay] → [Processing Time] → [Presentation Delay] → [Visual Update]
     ↑               ↑                 ↑                     ↑
  Click/Tap     Main Thread         Event Handler         Layout +
  Keypress      Congestion          Execution Time          Paint
Audit → Action → Tool: Main-Thread Concurrency
Audit: The main thread is where most tasks run in the browser, and where almost all JavaScript you write is executed. The main thread can only process one task at a time. Therefore, any task that takes longer than 50 milliseconds is a long task.
Action — Yield to the Main Thread: To make sure important user-facing tasks happen before lower-priority tasks, you can yield to the main thread by briefly interrupting your work. This gives the browser opportunities to run more important tasks. Comprehensive yielding APIs include scheduler.postTask() and scheduler.yield().
// ❌ PROTOCOL VIOLATION: Synchronous long task blocks all interactions
function processUserSubmission(formData) {
  const results = [];
  for (let i = 0; i < formData.length; i++) {
    results.push(heavyValidation(formData[i])); // Blocks for 300ms
  }
  return results;
}

// ✅ 100/100 PROTOCOL: Yield every 10 iterations using scheduler.yield()
async function processUserSubmission(formData) {
  const results = [];
  for (let i = 0; i < formData.length; i++) {
    results.push(heavyValidation(formData[i]));
    if (i % 10 === 0) {
      await scheduler.yield(); // Hands control back to the browser
    }
  }
  return results;
}
Action — Web Workers for Main-Thread Concurrency: Implement web workers for computationally expensive operations that do not require DOM access. Workers run on separate threads. Consequently, they prevent heavy calculations from blocking main-thread interaction processing. This works particularly well for data processing, image manipulation, and complex algorithms.
// main.js — Delegate CPU-intensive work off the main thread entirely
const worker = new Worker('/workers/data-processor.js');

button.addEventListener('click', () => {
  showLoadingState(); // Immediate visual feedback — critical for INP
  worker.postMessage({ payload: largeDataset });
});

worker.addEventListener('message', (e) => {
  hideLoadingState();
  renderResults(e.data); // DOM update only after worker resolves
});

// /workers/data-processor.js — Runs on a separate thread
self.addEventListener('message', (e) => {
  const result = expensiveComputation(e.data.payload);
  self.postMessage(result);
});
One real-world case: an analytics dashboard audited with 680ms INP had every click triggering heavy computations on the main thread. After optimization using Web Workers, code splitting, and React memoization, they achieved 145ms INP. That is a direct wordpress core web vitals fix result in production.
Tool: Chrome DevTools Performance Panel → Interactions tab. Filter by “Long Tasks” (shown in red). Any block exceeding 50ms is a main-thread violation.
Audit → Action → Tool: Third-Party Script Contamination
Audit: Third-party scripts — such as analytics or social media buttons — can add substantial overhead, slowing page responsiveness. When these scripts are loaded synchronously, they delay interaction handling and impact INP.
Action: Delaying non-essential scripts from tools like Google Tag Manager (GTM) can make a noticeable difference. Scripts such as Hotjar, which can be resource-intensive and occasionally block the main thread, should be loaded only after critical resources.
<!-- ❌ VIOLATION: Synchronous GTM fires before any interaction is possible -->
<script src="https://www.googletagmanager.com/gtm.js?id=GTM-XXXXX"></script>

<!-- ✅ 100/100 PROTOCOL: Load GTM after the page is interactive -->
<script>
  window.addEventListener('load', () => {
    setTimeout(() => {
      const s = document.createElement('script');
      s.src = 'https://www.googletagmanager.com/gtm.js?id=GTM-XXXXX';
      s.async = true;
      document.head.appendChild(s);
    }, 3000); // 3-second post-load delay
  });
</script>
Tool: Chrome DevTools → Performance Panel → Third-party badge filter. Cross-reference with PageSpeed Insights “Reduce JavaScript execution time” audit.
Audit → Action → Tool: Event Handler Efficiency
Audit: Inefficient event handling is a significant cause of INP delays. When interactions like clicks or taps trigger heavy operations, they block the UI thread and cause slow responsiveness.
Action: Debounce and throttle appropriately for events that fire repeatedly. Scroll, resize, and input events can trigger hundreds of times per second. Debouncing delays execution until events stop firing. Throttling, on the other hand, limits execution frequency.
// ✅ Debounced search input — prevents main thread saturation
const searchInput = document.getElementById('search');

const debouncedSearch = debounce(async (query) => {
  const results = await fetchResults(query);
  renderSearchResults(results);
}, 200);

searchInput.addEventListener('input', (e) => {
  debouncedSearch(e.target.value);
});

function debounce(fn, delay) {
  let timer;
  return (...args) => {
    clearTimeout(timer);
    timer = setTimeout(() => fn(...args), delay);
  };
}
Tool: web-vitals JavaScript library → onINP() observer with attribution for interaction-level debugging.
Section 2: LCP — Priority Signals and Edge Delivery Architecture
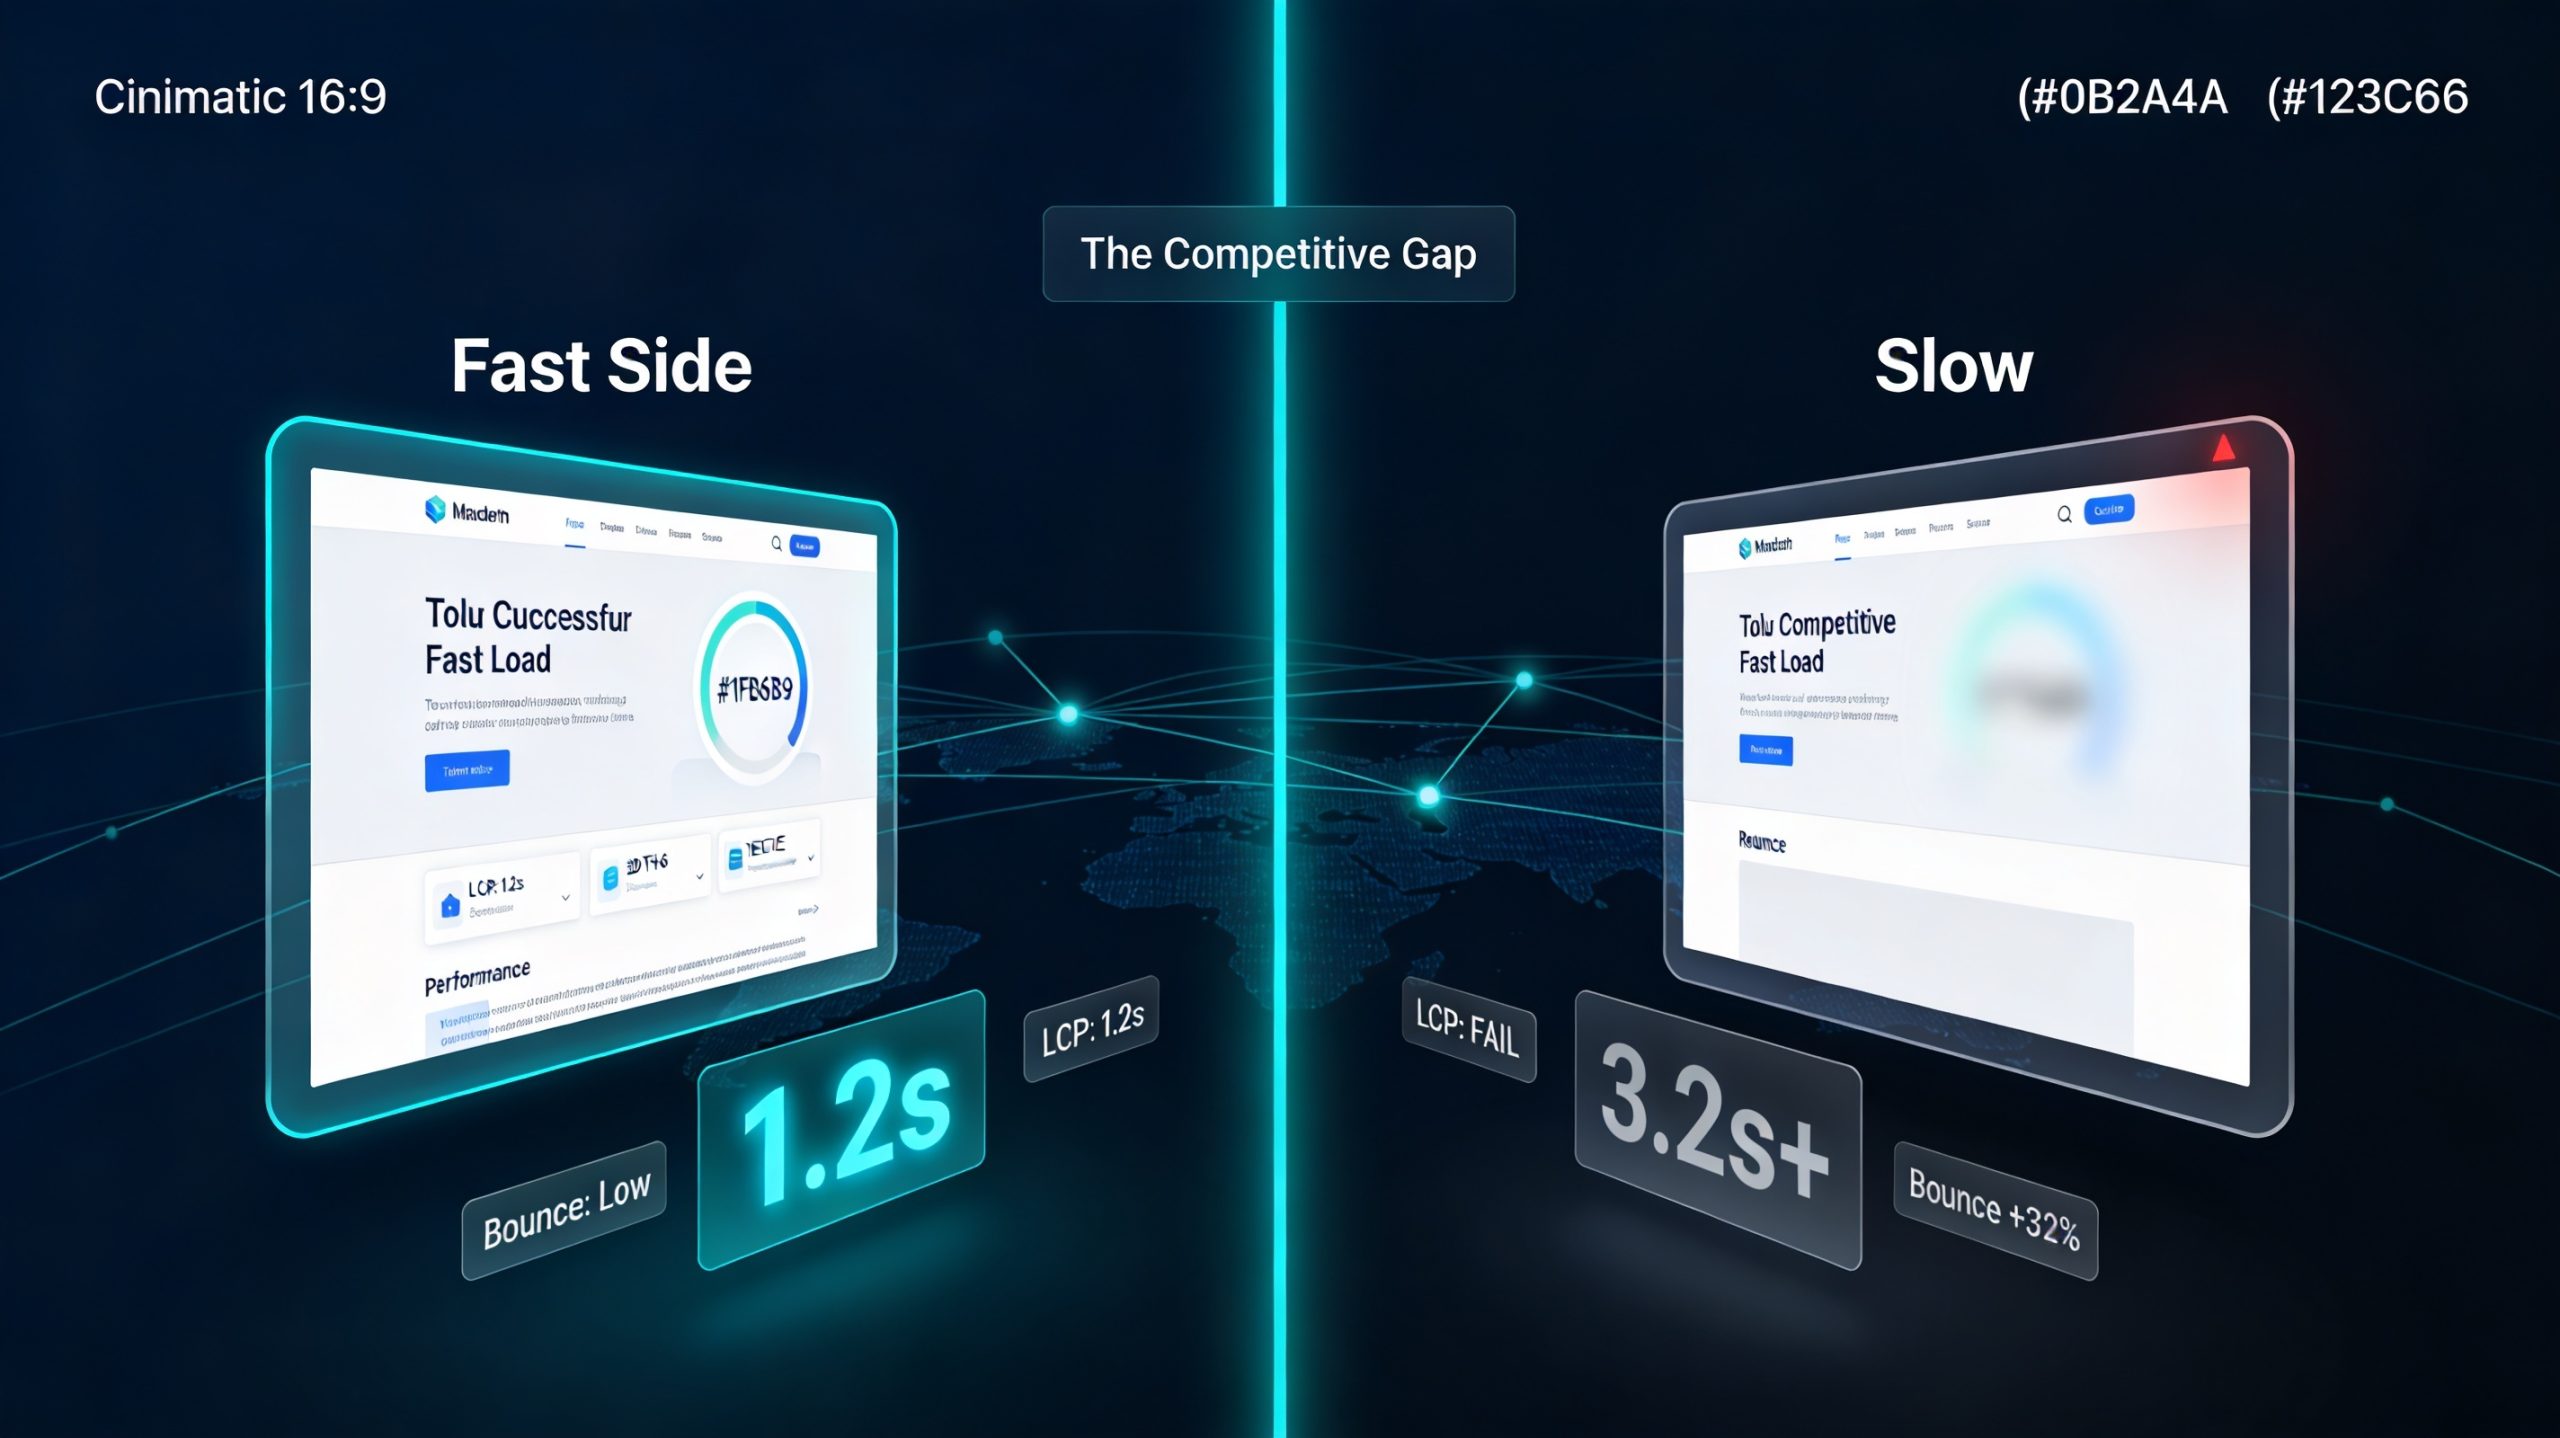
The LCP Equation: Why WordPress Core Web Vitals Fix Starts Here
For every second of delay beyond the 2.5-second LCP threshold, bounce rates increase by 32%. The 100/100 Engineering Protocol does not aim for 2.5 seconds. Instead, it targets 1.2 seconds. That gap is where competitive advantage lives.
Common causes of poor LCP include slow server response times, render-blocking JavaScript and CSS, slow resource load times, and client-side rendering delays. Therefore, a complete wordpress core web vitals fix must address all four causes systematically.
Audit → Action → Tool: Priority Hints and the Hero Image Protocol
Audit: The browser’s default behavior is to process your HTML waterfall sequentially. Without intervention, it discovers your hero image late — after CSS, scripts, and other resources have been queued.
Action — fetchpriority="high" Priority Hints: Priority Hints allow you to signal the browser’s resource scheduler directly. This instructs it to treat the LCP image as the highest-priority network request during the initial load waterfall.
<!-- ❌ VIOLATION: Browser treats hero image at default priority -->
<img src="/hero.webp" alt="Hero" width="1200" height="600" loading="eager" />

<!-- ✅ 100/100 PROTOCOL: Priority Hint + explicit dimensions + AVIF format -->
<img
  src="/hero.avif"
  fetchpriority="high"
  decoding="async"
  alt="Hero Banner"
  width="1200"
  height="600"
  loading="eager"
/>

<!-- Also preload the LCP resource in <head> for maximum signal strength -->
<link
  rel="preload"
  as="image"
  href="/hero.avif"
  fetchpriority="high"
  type="image/avif"
/>
A critical violation engineers miss: loading="lazy" on the hero image guarantees a LCP regression. The browser waits to start loading it until the page is scrolled — but it is visible immediately. Therefore, never apply loading="lazy" to the LCP element. It is incompatible with 100/100 targets.
Tool: Chrome DevTools → Network tab. Filter by “Img.” Confirm the LCP resource is assigned “Highest” priority in the Priority column.
Audit → Action → Tool: TTFB Reduction via Server-Side Rendering and CDN Architecture
Audit: Slow hosting makes passing LCP extremely difficult since server response time directly impacts loading speed. If your server takes more than 600ms to respond, upgrading hosting should be your first priority.
Action — Critical CSS Inlining: Eliminate render-blocking resources by deferring non-critical JavaScript, inlining critical CSS directly in the HTML head, and using async or defer attributes on script tags.
<head>
  <!-- ✅ Critical CSS inlined — eliminates a full render-blocking network round trip -->
  <style>
    /* Above-the-fold styles only — target < 14KB uncompressed */
    body { margin: 0; font-family: 'Inter', sans-serif; }
    .hero { width: 100%; height: 100vh; background: #000; }
    .hero__image { width: 100%; height: 100%; object-fit: cover; }
    .nav { position: fixed; top: 0; width: 100%; z-index: 100; }
  </style>

  <!-- Full stylesheet loaded non-render-blocking -->
  <link rel="preload" href="/styles/main.css" as="style"
        onload="this.onload=null;this.rel='stylesheet'" />
  <noscript><link rel="stylesheet" href="/styles/main.css" /></noscript>
</head>
Action — Edge Side Includes (ESI) for Dynamic Content Delivery: ESI is a markup language executed at the CDN edge layer. It allows you to cache static page shells and dynamically assemble personalized or real-time content at the edge. Consequently, this eliminates origin round trips for dynamic segments.
<!-- ESI fragment — executed at Fastly/Akamai/Cloudflare edge, not origin -->
<esi:include src="/api/user-header" maxage="0" onerror="continue">
  <esi:alt src="/fragments/generic-header.html" />
</esi:include>

<main class="product-listing">
  <!-- Static product HTML — 30-day CDN cache -->
</main>
Tool: WebPageTest → Waterfall view → TTFB measurement. Target: sub-200ms TTFB from CDN edge.
Audit → Action → Tool: Render-Blocking Resource Elimination
Audit: Open Chrome DevTools → Coverage Tab. Run a page load. Any JS or CSS file with more than 50% unused bytes on initial load is a payload minification and code-splitting candidate.
<!-- ❌ VIOLATION: Render-blocking scripts in <head> -->
<script src="/bundle.js"></script>
<script src="/analytics.js"></script>

<!-- ✅ 100/100 PROTOCOL: Deferred non-critical JS -->
<script src="/critical-init.js"></script>
<script src="/bundle.js" defer></script>
<script src="/analytics.js" async></script>
Tool: Chrome DevTools → Coverage Tab for unused byte identification. Lighthouse → “Eliminate render-blocking resources” audit for waterfall impact quantification.
Section 3: CLS — The Engineering Discipline of Visual Stability

CLS Is Not an Image Problem — It Is an Architecture Problem
Layout shifts occur when elements move after initial rendering. They are typically caused by images without dimensions, ads or embeds that inject content, or web fonts that cause text to reflow. A 0.0 CLS score in production is not achieved by “adding width and height.” It is achieved by designing a DOM structure where no element can shift — under any load condition, on any device, with any third-party content injection.
Audit → Action → Tool: The Empty State Strategy for Ads and Dynamic Banners
Audit: Use Chrome DevTools Layout Shift Regions (Performance tab → enable “Layout Shift Regions” in Rendering drawer). Watch for blue flash regions when ads, banners, or chat widgets inject content.
Action — Reserve Space Before Content Loads: The Empty State Strategy dictates that every dynamic injection zone — ads, banners, recommended content widgets, cookie notices — must have its spatial footprint declared in the DOM before any content arrives. This is a core part of any wordpress core web vitals fix implementation.
/* ✅ Ad Container — space reserved regardless of ad fill status */
.ad-container {
  width: 100%;
  min-height: 250px;
  background-color: #f5f5f5;
  display: flex;
  align-items: center;
  justify-content: center;
  contain: layout;
}

.ad-container--responsive {
  aspect-ratio: 728 / 90;
  max-width: 728px;
}
<!-- ✅ Skeleton placeholder prevents shift when dynamic content loads -->
<div class="ad-container" aria-label="Advertisement loading">
<span class="skeleton-placeholder" aria-hidden="true"></span>
</div>Tool: PageSpeed Insights → CLS breakdown with element-level attribution. DebugBear Real User Monitoring → CLS by interaction type.
Audit → Action → Tool: Font-Display Swap — The Double-Edged Sword
Audit: font-display: swap is universally recommended for LCP improvement. However, it is rarely acknowledged as a potential CLS accelerant. The problem is that swap renders your fallback system font immediately, then replaces it with your web font when loaded. If your web font has different metrics than the fallback, every line of text reflows. On a text-heavy page, this single reflow can generate a CLS score of 0.15 or higher.
Action — size-adjust and ascent-override Descriptor Protocol:
/* ✅ 100/100 PROTOCOL: Calibrate fallback font metrics to match web font exactly */
@font-face {
  font-family: 'FallbackForInter';
  src: local('Arial');
  size-adjust: 107%;
  ascent-override: 90%;
  descent-override: 22%;
  line-gap-override: 0%;
}

@font-face {
  font-family: 'Inter';
  src: url('/fonts/inter-var.woff2') format('woff2');
  font-display: swap;
  font-weight: 100 900;
}

body {
  font-family: 'Inter', 'FallbackForInter', sans-serif;
}
<link
rel="preload"
href="/fonts/inter-var.woff2"
as="font"
type="font/woff2"
crossorigin
/>
Tool: Fontaine (automated metric matching) or the Google Fonts CSS API with manual @font-face override for metric tuning.
Audit → Action → Tool: DOM Size Optimization for Rasterization Performance
Audit: Chrome DevTools → Performance panel → “Avoid an excessive DOM size” Lighthouse audit. Any DOM exceeding 1,400 nodes or a tree depth greater than 32 introduces rasterization overhead that cascades into CLS and INP degradation.
// ✅ Virtual rendering — render only what's in the viewport
import { VirtualList } from 'virtual-list-lib';

const virtualList = new VirtualList({
  container: document.getElementById('product-list'),
  totalItems: 10000,
  itemHeight: 80,
  renderItem: (index) => {
    const el = document.createElement('div');
    el.className = 'product-card';
    el.innerHTML = renderProduct(products[index]);
    return el;
  }
});
Tool: Chrome DevTools → Elements panel → count DOM nodes. Lighthouse “Avoid excessive DOM size” audit (flags more than 1,500 nodes).
Section 4: Speculative Rendering — The 2026 Performance Frontier

The Speculation Rules API: Pre-Rendering the Next Page Before the Click
The Speculation Rules API is designed to improve performance for future navigations. It targets document URLs rather than specific resource files. Therefore, it makes sense for multi-page applications (MPAs) rather than single-page applications (SPAs).
Including prerender rules inside a <script type="speculationrules"> element will cause supporting browsers to fetch, render, and load the content into an invisible tab, stored in a per-document in-memory cache. This includes loading all subresources, running all JavaScript, and even loading subresources and performing data fetches started by JavaScript.
The data from production deployments is clear: prerendered navigations have a p75 LCP of 320ms compared to 1,800ms for standard navigations on the same sites — an 82% improvement from a single API. Furthermore, Shopify rolled out conservative prefetch across their entire platform in June 2025, showing a 130ms average improvement on desktop and 180ms on mobile across all paint metrics.
Implementation Protocol:
<script type="speculationrules">
{
  "prerender": [
    {
      "source": "document",
      "where": {
        "selector_matches": "nav a, .product-card a"
      },
      "eagerness": "moderate"
    }
  ],
  "prefetch": [
    {
      "source": "document",
      "where": {
        "selector_matches": "a[href]",
        "not": {
          "selector_matches": "a[href*='/logout'], a[href*='/cart/delete']"
        }
      },
      "eagerness": "conservative"
    }
  ]
}
</script>
The eagerness setting defines when speculations should run. immediate speculates as soon as the speculation rules are observed. moderate performs speculations if you hover over a link for 200 milliseconds. conservative, on the other hand, speculates on pointer or touch down.
Since WordPress 6.8 (April 2025), speculation rules are built into WordPress Core. The default configuration uses prefetch with conservative eagerness, applied to all frontend pages when the visitor is not logged in and permalinks are enabled. This makes the wordpress core web vitals fix for navigation speed more accessible than ever.
Tool: Chrome DevTools → Application panel → Speculative Loads. Monitor hit rate, prerender status, and activation events.
Section 5: Standard vs. 100/100 Engineering Protocol Comparison
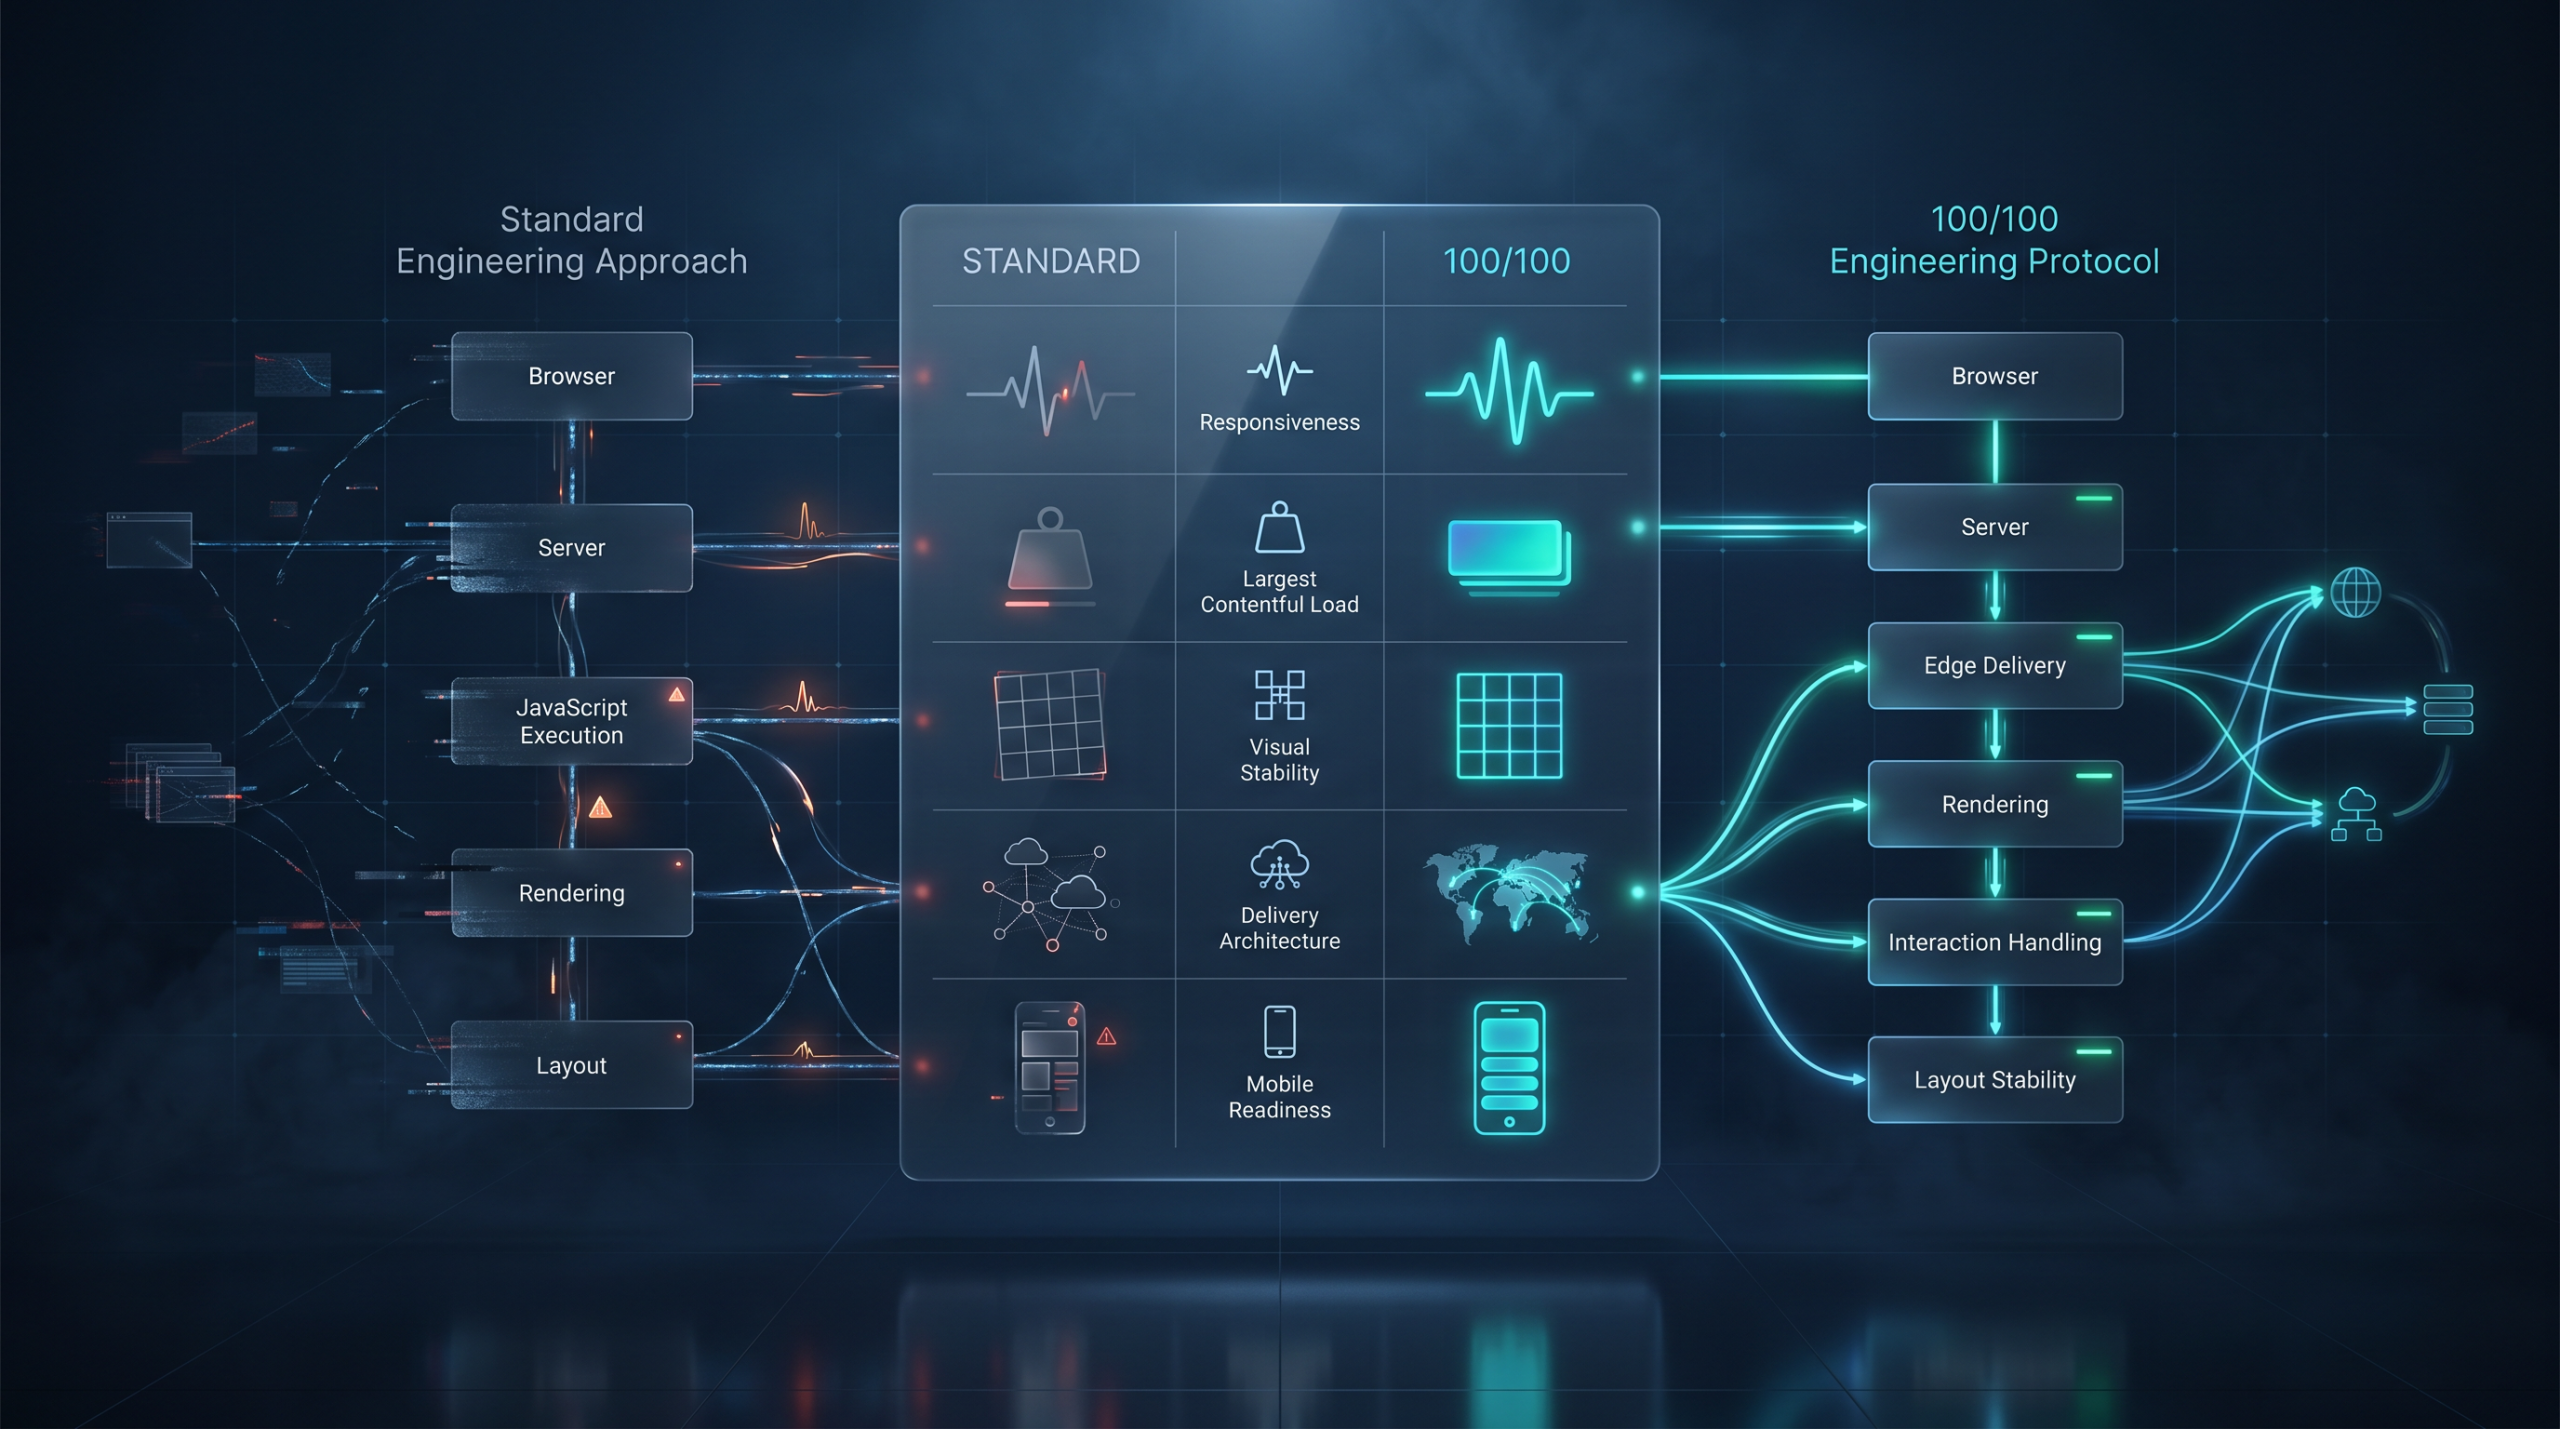
| Dimension | Standard Optimization | 100/100 Engineering Protocol |
|---|---|---|
| LCP Target | <2.5s (“Good” per Google) | <1.2s (100/100 threshold) |
| INP Target | <200ms | <50ms |
| CLS Target | <0.1 | 0.0 |
| Image Delivery | WebP compression | AVIF + fetchpriority="high" + <link rel="preload"> |
| CSS Delivery | Minified external stylesheet | Critical CSS inlined, non-critical preloaded non-blocking |
| JS Architecture | Bundle with defer | Code-split, Web Workers for CPU work, scheduler.yield() for long tasks |
| Font Strategy | font-display: swap |
swap + size-adjust + ascent-override metric calibration |
| Ad/Dynamic Content | Lazy-loaded injection | Empty state containers with aspect-ratio + CSS containment |
| Third-Party Scripts | Async load | Post-interaction delayed load (3s+ after page load event) |
| Navigation Speed | Standard HTTP request | Speculation Rules API prerender with moderate eagerness |
| Server Architecture | Origin response | Edge-cached HTML + ESI for dynamic fragments |
| DOM Size | Unmanaged | <1,400 nodes, virtual rendering for lists >100 items |
| Monitoring | Lighthouse lab scores | CrUX field data + web-vitals library RUM pipeline |
| Font Loading | Default browser behavior | Preloaded woff2 + variable fonts (single file, full axis) |
AEO FAQ: The Questions That Matter in 2026
Why Does My Lighthouse Score Differ from Field Data (CrUX)?
This is the most misunderstood gap in performance engineering. Lighthouse is a lab tool. It runs a simulated page load on a single controlled device, at a fixed network throttle, at a single moment in time. CrUX (Chrome User Experience Report), however, is the field.
To pass Core Web Vitals, at least 75% of your visitors need to have a “good” LCP, INP, and CLS score in the Google CrUX dataset on the URL level. Google uses the 75th percentile of real user data to determine whether a page passes. Therefore, 75% of page visits must have a “good” experience for the page to pass.
Stop optimizing for Lighthouse. Instead, use it as a diagnostic, not a scoreboard. The scoreboard lives at CrUX, and the gap between the two can be an order of magnitude. A 98/100 Lighthouse score with a “Needs Improvement” CrUX INP means you have solved the wrong problem. Consequently, your wordpress core web vitals fix must target real user data, not lab simulations.
The correct monitoring stack:
// ✅ Production RUM pipeline using web-vitals library
import { onINP, onLCP, onCLS } from 'web-vitals/attribution';

function sendToAnalytics(metric) {
  const payload = {
    name: metric.name,
    value: metric.value,
    rating: metric.rating,
    delta: metric.delta,
    id: metric.id,
    url: window.location.href,
    deviceType: /Mobi|Android/i.test(navigator.userAgent) ? 'mobile' : 'desktop',
  };

  if (metric.attribution) {
    payload.attribution = {
      interactionTarget: metric.attribution.interactionTarget,
      interactionType: metric.attribution.interactionType,
      inputDelay: metric.attribution.inputDelay,
      processingDuration: metric.attribution.processingDuration,
      presentationDelay: metric.attribution.presentationDelay,
    };
  }

  navigator.sendBeacon('/api/vitals', JSON.stringify(payload));
}

onINP(sendToAnalytics);
onLCP(sendToAnalytics);
onCLS(sendToAnalytics);
How Does Heavy Third-Party Tracking Kill INP?
One of the biggest culprits behind INP delay is JavaScript execution. Long-running JavaScript tasks block the main thread. Consequently, the browser cannot immediately respond to user interactions. GTM is a container that executes every tag you have loaded into it — synchronously, on the main thread, during page load.
A site with GTM + Meta Pixel + GA4 + Hotjar + LinkedIn Insight Tag loaded at page start can have 400–600ms of third-party main-thread blocking time before a user’s first interaction is even processable. The protocol for a proper wordpress core web vitals fix is strict:
- Delay GTM initialization by 3–5 seconds post-load via
setTimeout - Audit your GTM container — remove any tag firing on “Page View” that is not directly revenue-attributable
- Replace synchronous tag firing with consent-triggered or interaction-triggered firing rules
- Use Partytown to relocate third-party scripts to a Web Worker
// ✅ Interaction-deferred third-party load — fires on first user gesture
let thirdPartyLoaded = false;

const loadThirdPartyScripts = () => {
  if (thirdPartyLoaded) return;
  thirdPartyLoaded = true;

  (function(w,d,s,l,i){w[l]=w[l]||[];w[l].push({'gtm.start':
  new Date().getTime(),event:'gtm.js'});var f=d.getElementsByTagName(s)[0],
  j=d.createElement(s),dl=l!='dataLayer'?'&l='+l:'';j.async=true;
  j.src='https://www.googletagmanager.com/gtm.js?id='+i+dl;
  f.parentNode.insertBefore(j,f);})(window,document,'script','dataLayer','GTM-XXXXX');
};

['click', 'touchstart', 'keydown', 'scroll'].forEach(event => {
  document.addEventListener(event, loadThirdPartyScripts, { once: true, passive: true });
});
What Is the Speculative Rules API and How Does It Help 2026 Performance?
The Speculation Rules API is a powerful tool for enhancing web performance, primarily in multi-page applications (MPAs). It proactively prefetches or prerenders potential next pages. As a result, it allows the browser to start loading a subsequent page before a user even clicks a link, making navigation feel nearly instantaneous.
In technical terms, prerendering via the Speculation Rules API executes the full page lifecycle — HTML parsing, subresource loading, JavaScript execution, layout, and paint — in a hidden browsing context. When the user navigates, the browser activates this pre-built document rather than initiating a new request. Consequently, the navigation appears instantaneous.
Sites using speculation rules with moderate eagerness see roughly 28% of navigations successfully prefetched or prerendered. Furthermore, prefetched navigations show a p75 TTFB of just 45ms, because the HTML is already in the browser’s in-memory cache. For e-commerce funnels, SaaS onboarding flows, and content-heavy MPAs, this is the highest-leverage single implementation available in any wordpress core web vitals fix toolkit.
Section 6: The Continuous Audit Protocol
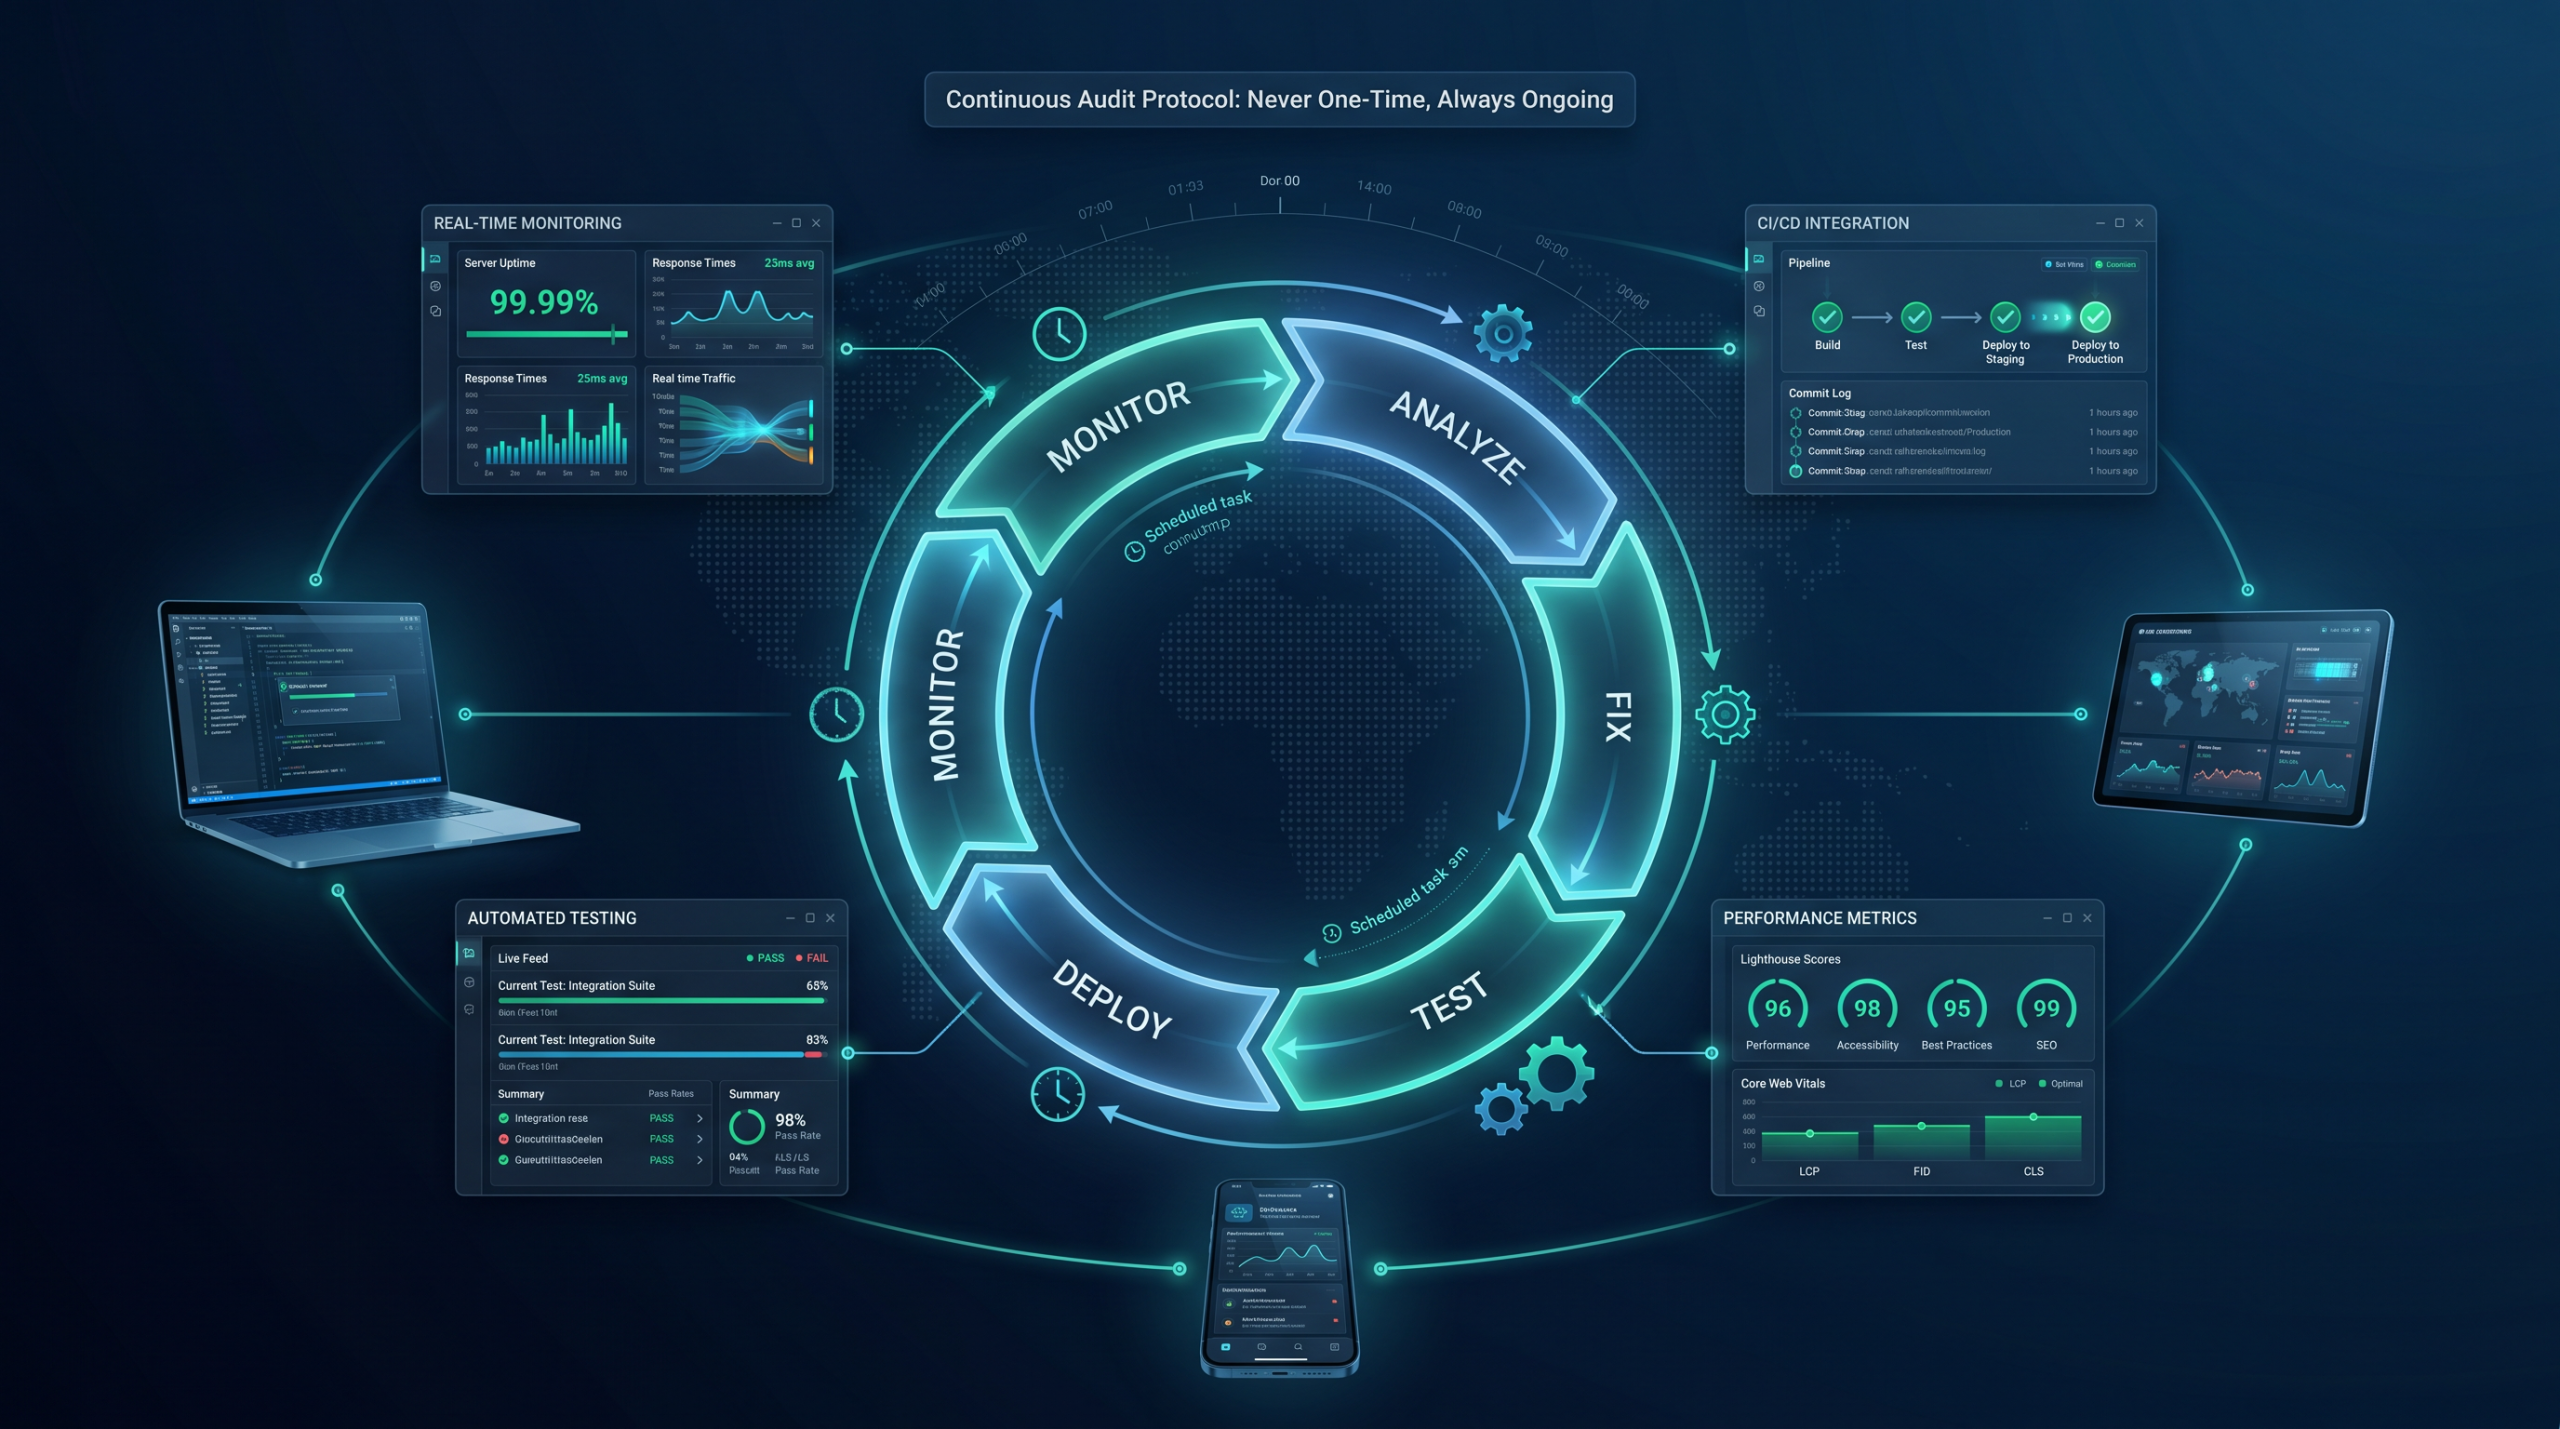
Performance engineering is not a deployment event. It is a continuous discipline. Therefore, configure alerts for when your Core Web Vitals 75th percentile values cross thresholds. A sudden INP spike after a deploy, a gradual LCP creep as images grow, or a CLS regression from a new ad script — you want to know about these before they affect your 28-day CrUX window and ranking.
Set alerts at 80% of Google’s thresholds: INP > 160ms, LCP > 2.0s, CLS > 0.08. Additionally, learn how WPscaleops handles ongoing Core Web Vitals monitoring for client sites.
Your WordPress Core Web Vitals Fix Monitoring Stack for 2026
| Layer | Tool | Signal Type |
|---|---|---|
| Lab Testing | Lighthouse CI in deployment pipeline | Regression gating |
| Lab Interaction | Chrome DevTools Performance Panel | INP phase attribution |
| Field Data | CrUX via PageSpeed Insights | Real 75th percentile |
| RUM Pipeline | web-vitals library → BigQuery/GA4 | Segment by device, route, country |
| Alerting | DebugBear / Calibre / SpeedCurve | Threshold breach notification |
| Speculative Load Audit | Chrome DevTools → Application → Speculative Loads | Prerender hit rate |
The Non-Negotiable CI Gate for WordPress Core Web Vitals Fix
# .github/workflows/performance.yml
- name: Lighthouse CI Audit
  run: |
    lhci autorun \
      --collect.url=https://staging.yoursite.com \
      --assert.assertions.largest-contentful-paint=error:1200 \
      --assert.assertions.cumulative-layout-shift=error:0 \
      --assert.assertions.total-blocking-time=error:150
  # Fail the deployment if LCP > 1.2s or CLS > 0 or TBT > 150ms
The 100/100 Master Checklist for WordPress Core Web Vitals Fix
LCP Protocol
- Hero image served as AVIF with WebP fallback
fetchpriority="high"on LCP element<link rel="preload">for LCP image in<head>- No
loading="lazy"on above-the-fold images - Critical CSS inlined (<14KB), full CSS preloaded non-blocking
- TTFB <200ms verified via WebPageTest from CDN edge
- Server-side rendering for LCP-containing HTML
- ESI implemented for dynamic content on cached pages
INP Protocol
- No synchronous long tasks >50ms on main thread (verified in DevTools)
- Web Workers implemented for all non-DOM computational work
scheduler.yield()inserted in all iterative processing loops- GTM + third-party scripts deferred post-load or interaction-triggered
- Event handlers verified as lightweight (<5ms synchronous execution)
- Debouncing applied to all high-frequency events (scroll, input, resize)
- DOM node count <1,400 (virtual rendering for large lists)
CLS Protocol
- All images and video elements have explicit
widthandheightattributes - Ad/banner containers have
min-heightoraspect-ratiopre-reserved - Font loading uses
font-display: swap+size-adjustcalibration - All
@font-facedeclarations haveascent-overrideanddescent-override - Variable fonts used to reduce font file count
- CSS
contain: layoutapplied to all dynamic injection zones - No content injection above existing content after initial paint
Speculative Rendering Protocol
- Speculation Rules API implemented for key navigation paths
- Logout, cart-delete, and state-mutating URLs excluded from rules
- Eagerness set to
moderatefor general links,conservativefor prefetch - Prerender hit rate monitored in DevTools → Application → Speculative Loads
Monitoring Protocol
web-vitalslibrary RUM pipeline active in production- INP attribution logging capturing interaction target + all three phases
- CrUX data reviewed weekly via Google Search Console
- Lighthouse CI blocking deployments at LCP >1.2s, CLS >0, TBT >150ms
- Alerting configured at 80% of Google thresholds
The milliseconds are not abstract. A one-second delay in load time reduces conversions by 7%. For an e-commerce site generating $100,000 per month, that is $7,000 in lost revenue every month. Therefore, the 100/100 Engineering Protocol is not perfectionism — it is the only defensible technical standard when performance is quantified in direct revenue impact. Moreover, every item on this checklist has a measurable dollar value attached to it.
Ready to implement a professional wordpress core web vitals fix across your entire site? Visit WPscaleops.com for engineering-grade performance management.
WPscaleops.com — Performance Engineering at the Millisecond Level.