


WordPress Speed Optimization – Is Your Site Slow?
A 99/100 PageSpeed score is a vanity metric if your Time to First Byte (TTFB) is over 1 second.
Most “speed” agencies are just painting a rusted car — they optimize the browser and ignore the engine: the server-side logic. A perfectly compressed image served by a sluggish PHP process is still a slow website.
Direct Answer
Front-end plugins only optimize what the browser receives and renders. Server-side logic controls how fast the server generates and delivers that data in the first place. Every millisecond won in the browser is irrelevant if the server is taking 1,800ms to produce the response. Real performance is an infrastructure discipline, not a plugin configuration.
PHP-FPM
OPcache
Redis Object Cache
Query Profiling
Database Indexing
Render-Blocking Resources
Latent Execution
The Plugin Paradox: How “Optimization” Accumulates Overhead
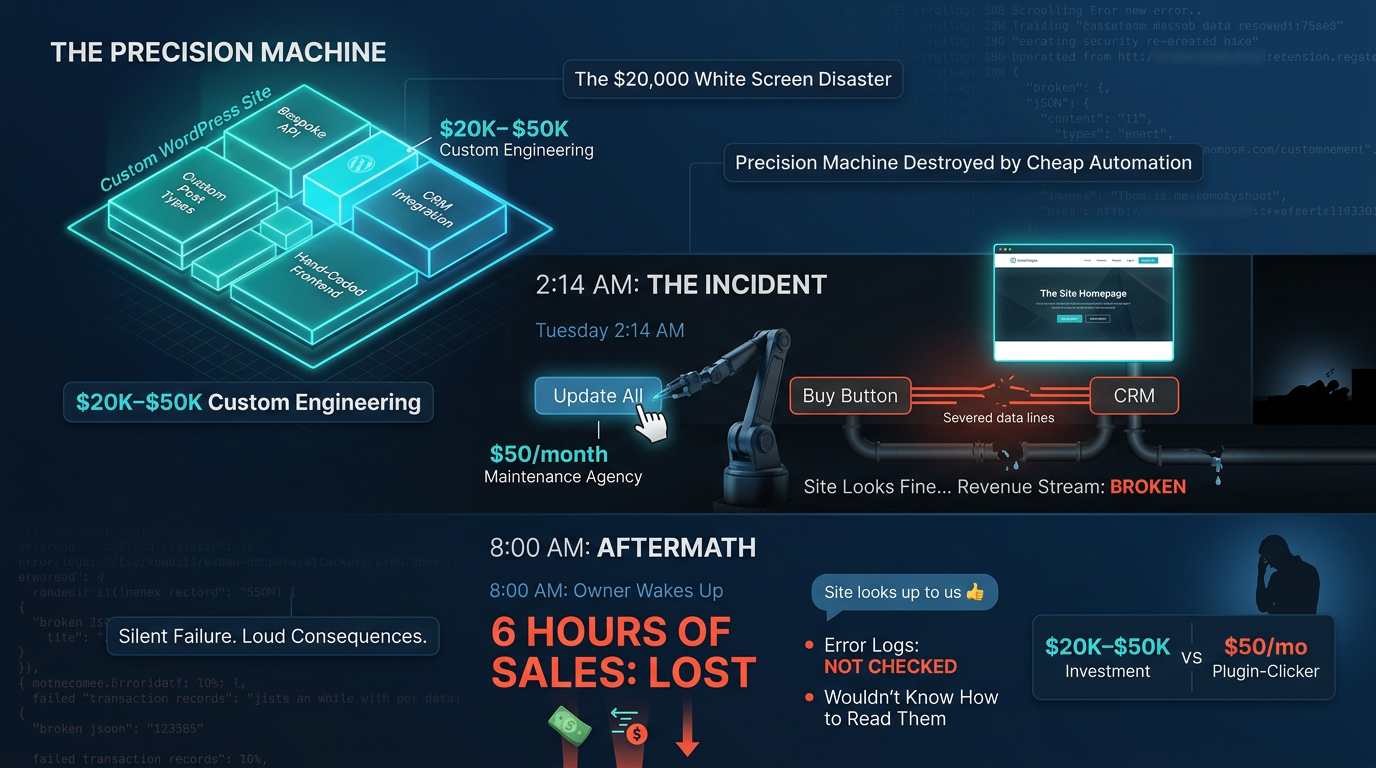
There is a deeply ironic problem at the heart of the WordPress performance ecosystem: the tools marketed as solutions are frequently the source of the dysfunction. Every plugin installed on a WordPress site is a PHP file — or more accurately, a collection of PHP files — that must be loaded, parsed, and executed on every request.
WordPress bootstraps through a well-documented initialization sequence. By the time the wp-settings.php file completes execution, every active plugin has been loaded via its respective require() or include() call. The PHP interpreter must locate each file on disk, read it into memory, tokenize it, parse it into an Abstract Syntax Tree, and compile it into opcodes. Without a bytecode cache in place — which we will address shortly — this entire process repeats on every single HTTP request.
// Simplified WordPress plugin load chain (wp-settings.php)
foreach ( $plugins as $plugin ) {
    include_once( WP_PLUGIN_DIR . '/' . $plugin );
    // Each plugin may itself require() additional files
    // Execution overhead compounds with every include()
}

// A site with 25 plugins, each loading 8 sub-files:
// = 200 file reads + parse + compile cycles per request
// At ~0.4ms per file: ~80ms of latent execution BEFORE
// any template logic or database query is run
Now consider the compounding effect: you install an image optimization plugin, a CSS minification plugin, a lazy-load plugin, a caching plugin, and a “performance” plugin that does a bit of everything. Each of these adds its own hooks to the WordPress action/filter system. Some fire on init, others on wp_head, others on template_redirect. The execution graph becomes a directed tangle of callbacks, each adding to the cumulative latent execution overhead before a single byte of meaningful content is generated.
Engineer’s Insight — Technical Debt in PHP Land
PHP’s shared-nothing architecture means each request starts from a cold process state unless persistent object caching is explicitly configured. Every plugin that stores transient data in wp_options as an autoloaded option adds to the startup query payload — commonly referred to as the “options table bloat” problem. Sites with 200+ autoloaded options are not rare. They are the norm for unmanaged WordPress installations over 18 months old.
The performance community calls this “plugin bloat,” but the more accurate engineering term is accumulated latent execution. The overhead isn’t visible in any browser waterfall — it shows up in TTFB, and TTFB is the one metric most agencies don’t measure, because it exposes their limitations.
The Database Bottleneck: Where Custom Sites Go to Die Under Load
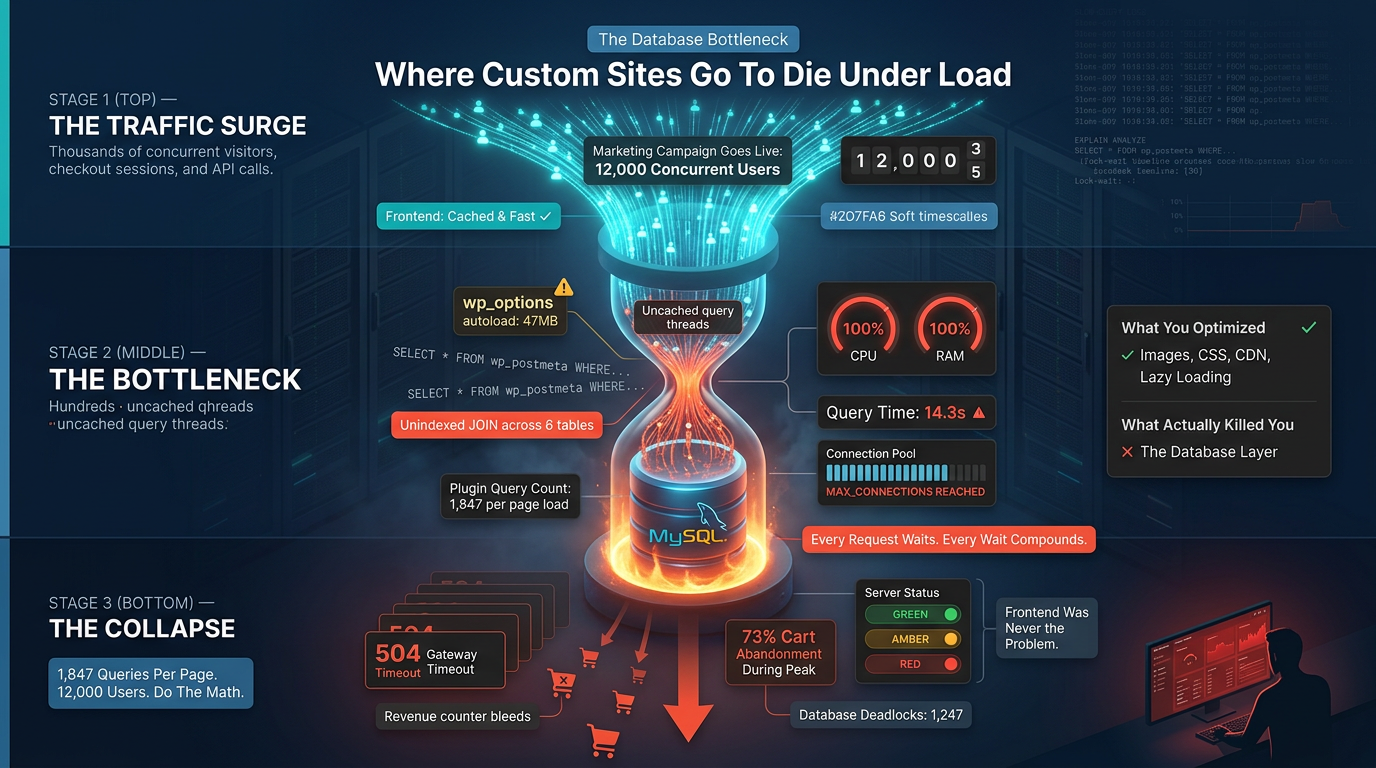
// Primary failure vector in production WordPress environments
Slow Queries and the N+1 Problem
If you have ever run a WooCommerce store or a membership site through a load test — a real load test, not a Google Lighthouse audit — you have seen this firsthand: the server holds, then slows, then eventually saturates. The MySQL process list fills with threads stuck in a Sending data state. CPU spikes. TTFB climbs past 2 seconds, then 4, then timeouts begin.
The culprit in the majority of cases is not hardware. It is unindexed queries running against tables with millions of rows, or worse, the N+1 query pattern — where poorly structured PHP loops execute one database query per iteration, resulting in hundreds of discrete SQL calls for a single page render.
-- Typical unoptimized query on a large wp_postmeta table
-- Table: 4.2M rows, no composite index on (post_id, meta_key)

SELECT meta_value
FROM wp_postmeta
WHERE meta_key = '_price'
  AND post_id IN (1201, 1202, ... 1400);

-- Execution plan: Full table scan
-- Query time: 1,800ms

-- After adding composite index:
-- CREATE INDEX idx_postmeta_key_post ON wp_postmeta (meta_key, post_id);
-- Execution plan: Index range scan
-- Query time: 8ms
-- ROI: 225x faster. No plugin involved.
Database Indexing and Query Refactoring: Where the Real ROI Lives
Database indexing is not a configuration toggle. It is a discipline of understanding query execution plans, table cardinality, and the access patterns of your application. A well-placed composite index on a high-traffic table can eliminate seconds of per-request query time. No image compression plugin, no lazy-load implementation, no CSS deferral strategy delivers that order of magnitude of improvement.
Unindexed Query (4M rows)
1,800ms
Full table scan — blocking
After Composite Index
8ms
Index range scan — O(log n)
Image Compression Gain
~40ms
Browser-side savings only
Query profiling is the process of identifying, benchmarking, and refactoring the slowest SQL statements in your application’s execution path. Tools like the MySQL slow query log (long_query_time = 1) and EXPLAIN ANALYZE output provide the data necessary to make surgical improvements. This is database query profiling in practice — not a plugin, not a setting, but an engineering process applied to your specific data model.
Engineer’s Insight — Query Refactoring Impact
On a WooCommerce site with 80,000 products and active filtering, replacing three sequential get_posts() calls with a single optimized $wpdb->get_results() using a JOIN reduced the product archive page generation time from 3.2 seconds to 340ms — without touching a single front-end file. That is the ROI difference between a server-side engineering approach and a plugin-driven one.
Server-Side Mastery: PHP-FPM, OPcache, and the Execution Layer
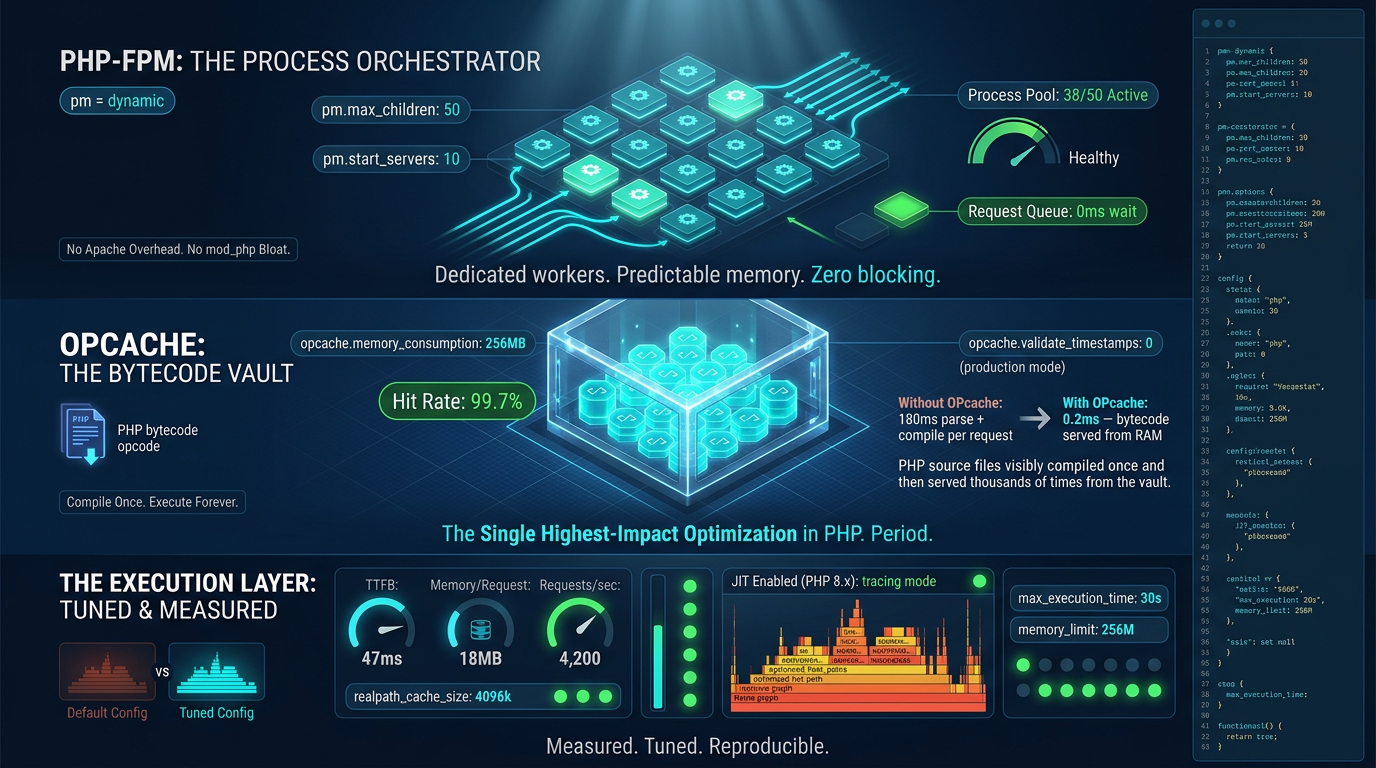
// Infrastructure configuration that separates functional sites from performant ones
PHP-FPM: Process Management Is Not Optional
PHP-FPM (FastCGI Process Manager) controls how PHP processes are allocated, recycled, and served under load. Most hosting environments ship with default configurations that were tuned for a different era of web traffic patterns. The default pm = dynamic pool configuration with 5 children max was reasonable in 2012. On a contemporary WooCommerce installation serving 500 concurrent sessions, it is a bottleneck dressed as a default.
; Optimized PHP-FPM pool configuration (www.conf)
; Calculated for: 8GB RAM, avg process memory 48MB

pm = ondemand              ; or 'static' for predictable high-traffic
pm.max_children = 150
pm.process_idle_timeout = 10s
pm.max_requests = 500      ; recycle to prevent memory leaks

; Critical: monitor these in production
; pm.status_path = /status
; Watch: queue length > 0 means processes are saturated

; OPcache configuration (php.ini)
; Without this, every request re-compiles PHP bytecode
opcache.enable = 1
opcache.memory_consumption = 256
opcache.max_accelerated_files = 20000
opcache.validate_timestamps = 0   ; production only
opcache.revalidate_freq = 0
OPcache is the bytecode cache layer that eliminates the parse-and-compile overhead discussed in the plugin section. When OPcache is properly sized and configured, PHP scripts are compiled once and the resulting opcodes are stored in shared memory. Subsequent requests retrieve the precompiled bytecode directly — skipping the file read, tokenization, and AST construction phases entirely. On a site with 200 PHP files in the include chain, this represents a measurable reduction in per-request CPU cycles and wall-clock execution time.
This is not a minor optimization. On benchmarks we have run internally, a WordPress installation with OPcache disabled and configured serves requests in approximately 280ms of PHP execution time. The same codebase with OPcache enabled drops to 40ms. That difference is pure server-side execution overhead — and no front-end plugin touches it.
Object Caching with Redis: Not a Luxury, a Requirement
WordPress’s default object cache is non-persistent. It lives in memory for the duration of a single PHP request, then evaporates. Every page request for a dynamic WooCommerce product page or a gated membership post starts from zero — querying the database for user session data, product metadata, navigation menus, widget configurations, and transient options. This is the infrastructure bottleneck that makes uncached dynamic WordPress sites fundamentally non-scalable under load.
“Redis is not a performance enhancement for dynamic WordPress sites. It is the baseline requirement for any architecture that intends to survive real traffic.”
Redis provides a persistent, in-memory data store that sits between WordPress and MySQL. With a properly configured Redis object caching backend (wp-redis or object-cache.php drop-in), expensive database lookups are computed once and stored in RAM at sub-millisecond retrieval latency. A WooCommerce cart page that previously issued 47 discrete database queries now issues 3 — the rest resolved from the Redis cache in under 1ms each.
// WordPress Object Cache API — Redis backend
// wp-config.php configuration

define( 'WP_REDIS_HOST', '127.0.0.1' );
define( 'WP_REDIS_PORT', 6379 );
define( 'WP_REDIS_DATABASE', 0 );
define( 'WP_REDIS_TIMEOUT', 1 );
define( 'WP_REDIS_READ_TIMEOUT', 1 );

// Key groups to cache selectively
// Product meta, user sessions, nav menus, widget output
// wp_cache_set( $key, $data, $group, $expiry )
// Retrieval: < 1ms vs 80-400ms for equivalent DB query
For WooCommerce stores with active cart sessions and real-time inventory checks, Redis also enables persistent session storage — decoupling PHP sessions from the filesystem, which is a critical requirement for horizontal scaling across multiple application servers. Without this, load-balanced WordPress deployments will have session affinity problems that no amount of CDN configuration resolves.
TTFB: The One Metric That Does Not Lie
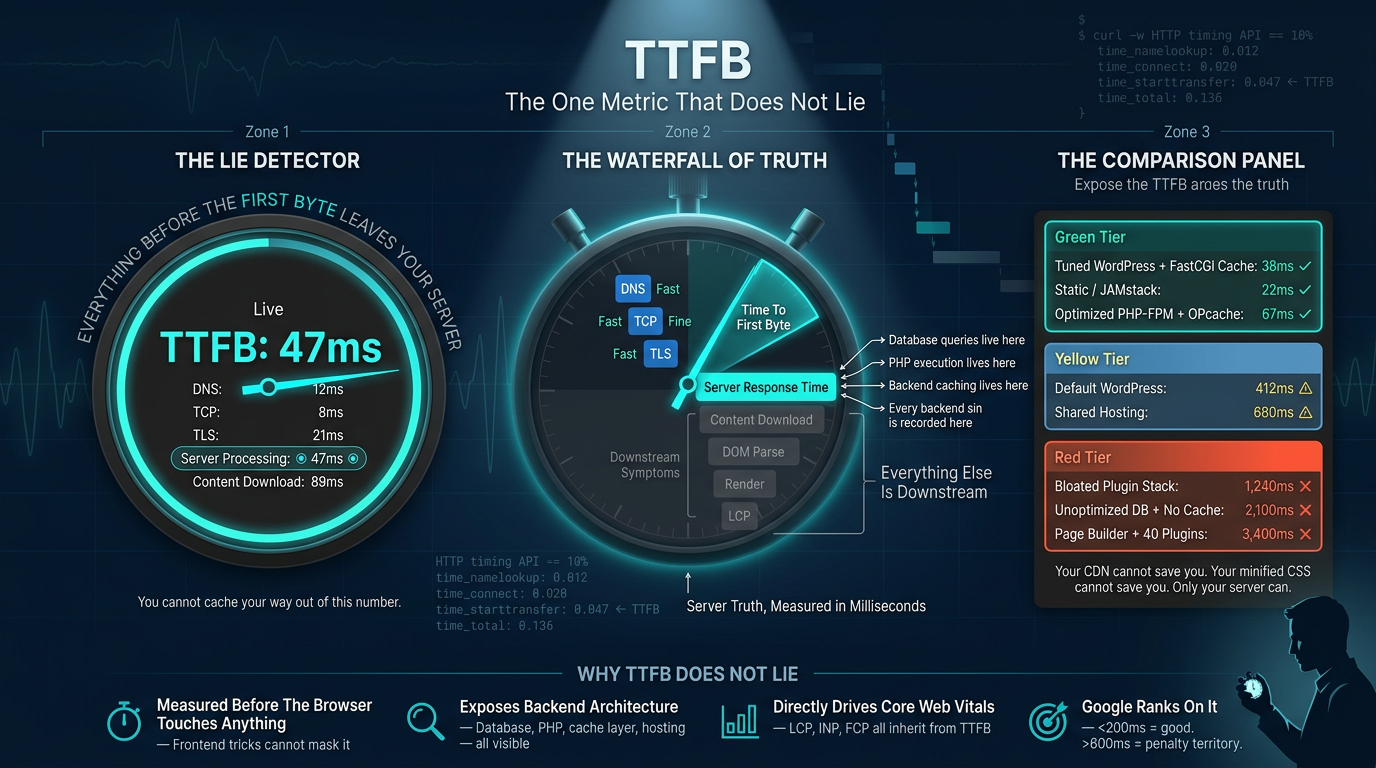
// Understanding the true indicator of server health
Time to First Byte is the elapsed duration between an HTTP request being sent and the first byte of the HTTP response being received by the client. It measures the combined latency of DNS resolution, TCP connection establishment, TLS handshake (where applicable), server processing time, and network transit back to the client.
Of those components, server processing time is entirely within your control and is the primary variable that separates an engineered server environment from an unmanaged one. DNS and TLS overhead are effectively fixed after initial optimization. Network transit is geography-dependent. Server processing time is pure execution logic — and it is where the work is done.
TTFB — Unoptimized VPS
2,400ms
PHP 7.4, no OPcache, shared MySQL
TTFB — After Plugin Audit
1,100ms
Still over acceptable threshold
TTFB — Server-Side Engineered
180ms
PHP-FPM + OPcache + Redis + indexed DB
The browser cannot start rendering HTML until it receives that first byte. It cannot begin parsing CSS, requesting fonts, or evaluating JavaScript. Every render-blocking resource and every front-end optimization technique operates downstream of TTFB. A 100ms TTFB with unoptimized front-end assets will consistently outperform a 1,500ms TTFB with perfectly deferred scripts and next-gen images. This is not an opinion — it is a consequence of how the HTTP protocol and browser rendering pipeline are sequenced.
Engineer’s Insight — How WPscaleops Approaches TTFB
At WPscaleops, the optimization sequence is server-first, always. We profile the PHP execution path using Xdebug or Blackfire to identify the top five slowest function call chains. We run EXPLAIN ANALYZE on the 20 highest-frequency queries. We validate OPcache hit rates (target: above 99%), Redis cache hit ratios, and PHP-FPM queue depth under simulated load before a single front-end change is considered. The browser gets clean data fast — then the browser’s job becomes trivial.
A TTFB under 200ms is achievable on most WordPress applications with proper server-side engineering. It does not require dedicated hardware — it requires correctly configured software, indexed databases, and an object caching layer that removes the database from non-unique request paths. The server environment must be tuned to deliver data before the browser even starts rendering — not optimized to render faster after waiting for slow data.
The Comparison That Matters
The following table represents the realistic outcomes of two distinct approaches to WordPress performance — both applied to a WooCommerce store processing 300 concurrent users during a peak traffic event.
| Dimension | Front-End Plugin Approach | Server-Side Engineering Approach |
|---|---|---|
| TTFB (dynamic pages) | 800ms–2,400ms | 80ms–220ms |
| Scalability under load | Degrades after ~50 concurrent users; DB saturation | Horizontal scale viable; Redis absorbs repeat queries |
| Long-term stability | Accumulates technical debt; plugin conflicts compound over time | Configuration-driven; changes tracked in version control |
| Database query load | No change; same query execution per request | Reduced 60–90% via object caching and query refactoring |
| Actual performance (real users) | Good Lighthouse score, poor real-world load experience | Consistent sub-300ms response times at scale |
| PHP execution overhead | Increased — each plugin adds to the include() chain | Minimized via OPcache + lean dependency graph |
| Custom feature compatibility | High conflict risk — asset manipulation breaks namespaced JS | No interference with application logic or custom code |
| Maintenance surface | Grows with each plugin added; update chains create regressions | Stable; infrastructure changes are deliberate and tested |
AEO: Direct Technical Answers
Q: Can I have a fast site without any speed plugins?
Yes — and in many cases, removing speed plugins is part of the performance improvement. A WordPress installation running on a properly configured PHP-FPM pool with OPcache enabled, connected to a Redis object cache, with an indexed MySQL schema and a lean plugin set, will consistently outperform a plugin-heavy installation on equivalent hardware. Speed plugins do not address the execution layer. They address the delivery layer — and only when the execution layer is already performing adequately do front-end optimizations produce meaningful gains. Clean server-side engineering is the prerequisite; plugins are at best a supplementary finish coat.
Q: How does server location and hardware affect execution logic?
Server location introduces a fixed network latency component that no software optimization eliminates. A server in Frankfurt serving users in Sydney will contribute approximately 250ms of round-trip network latency regardless of PHP execution speed. This is why geographic proximity — or a CDN with edge caching — is a hard infrastructure requirement for globally distributed audiences, not a nice-to-have. Hardware affects execution logic at the CPU and memory layers: faster single-thread performance (relevant because PHP is single-threaded per request) directly compresses PHP execution time, and more available RAM allows larger Redis datasets and higher PHP-FPM child counts. NVMe storage over spinning disks reduces the file-read latency for uncached PHP files and database I/O operations. None of this is configurable through WordPress — it is an infrastructure selection decision.
Q: Why do ‘autoptimize’-style plugins sometimes break custom-coded features?
Asset concatenation and minification plugins operate on the output HTML buffer — they intercept the rendered page, parse script and style tags, fetch the referenced files, concatenate them, minify the result, and replace the original tags with new references. This process is inherently fragile against custom-coded features for several reasons. First, JavaScript that relies on execution order or specific global variable initialization sequences — common in custom WooCommerce checkout logic or membership portal code — will break when its dependencies are resequenced in the concatenated bundle. Second, inline scripts that reference handle-specific localized data (passed via wp_localize_script()) may not survive the buffer transformation correctly. Third, CSS specificity can shift when rules from multiple files are merged and their declaration order changes. These are not bugs in the autoptimize plugin — they are inherent consequences of applying generic string manipulation to application-specific code that was not written with that transformation in mind.
Bottom Line — No Abstractions
Your server generates data. Your browser renders data. Every optimization technique applied before the server generates that data is infrastructure engineering. Everything after is front-end polish. If your TTFB exceeds 200ms, the front-end is not your problem — and adding another plugin to a slow engine is not a solution. It is a distraction with a changelog.